Z-Wave Mesh Network

Z-Wave Communication Protocol Tutorial for Smart Homes

Z-Wave Communication Protocol Tutorial for Smart Homes

In this tutorial, you learn how the Z-Wave communication protocol for smart home work.

After the technical key facts we take a closer look at Z-Wave mesh networks and why they are used in smart homes.

If you want to include security devices in your home like security cameras, I explain in this tutorial why you should use the Z-Wave series 700 in the future.

Z-Wave Logo

Table of Contents

Z-Wave is a very popular Smart Home communication protocol that is not based on the WiFi protocol for the communication but use wireless radio frequency to build a network with smart devices.

In 1990 Z-Wave was developed by the Danish company Zensys because they created a consumer light-control system and needed a communication protocol. To promote the technology of Z-Wave, five companies formed the Z-Wave Alliance in 2005. Sigma Designs in 2008 and Silicon Labs in 2018 acquired Z-Wave later on. Since 2005 the Z-Wave Alliance grows up to 700 members.

Not only the number of companies in the alliance grows over the years, the number of Z-Wave products also explodes. In 2005 there were 6 products in the market and by 2012 the number raises to 600 because of the increasing popularity of smart home devices. Today there are more than 2400 interoperable Z-Wave products on the market.

The interoperability is one of the main advantages from Z-Wave compared to other smart home communication protocols like ZigBee. This interoperability is achieved through a 2 steps certification program:

  1. First all smart devices get a technical certification through Silicon Labs because all Z-Wave chips are produces only by Silicon Labs.
  2. In the second step only the products with a market certification from the Z-Wave Alliance can be sold. During this process it is tested that the device is compatible with other Z-Wave smart devices.

The following table shows the technical key facts for the Z-Wave smart home communication protocol:

Z-Wave Mesh Network

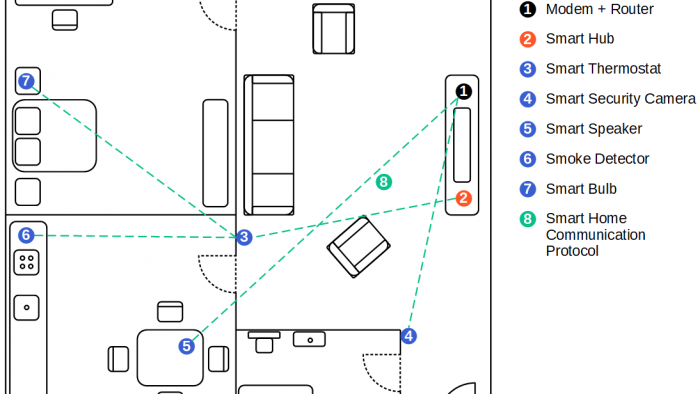
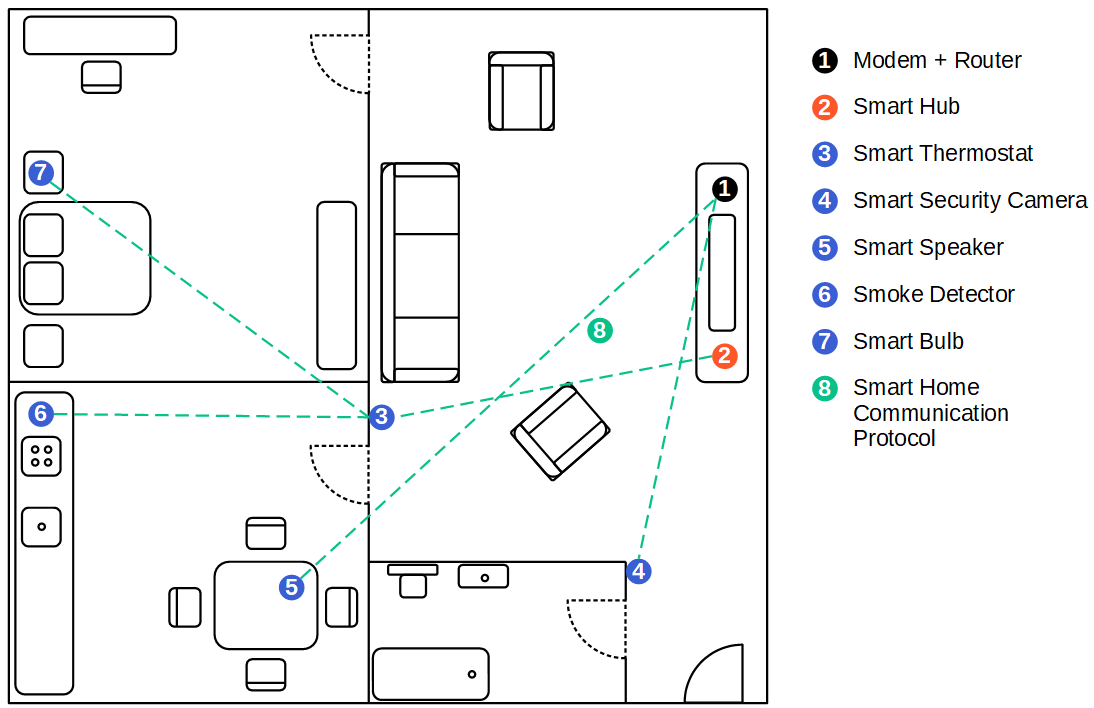
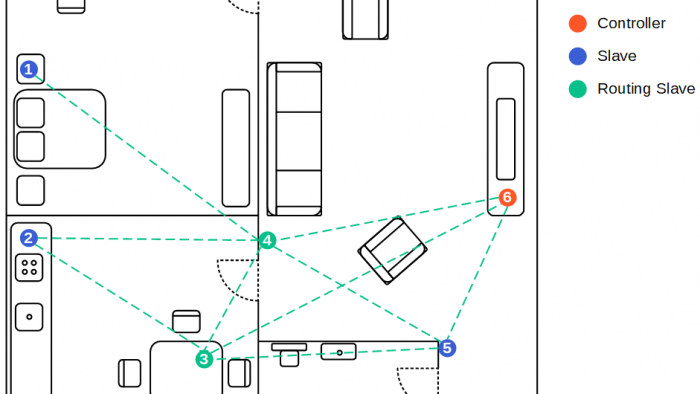
The following picture shows an example of a Z-Wave mesh network that can have up to 232 devices and could be further extended with a network bridge. A network bridge is a computer networking device that bridges multiple networks like if they were a single network.

Z-Wave Mesh Network

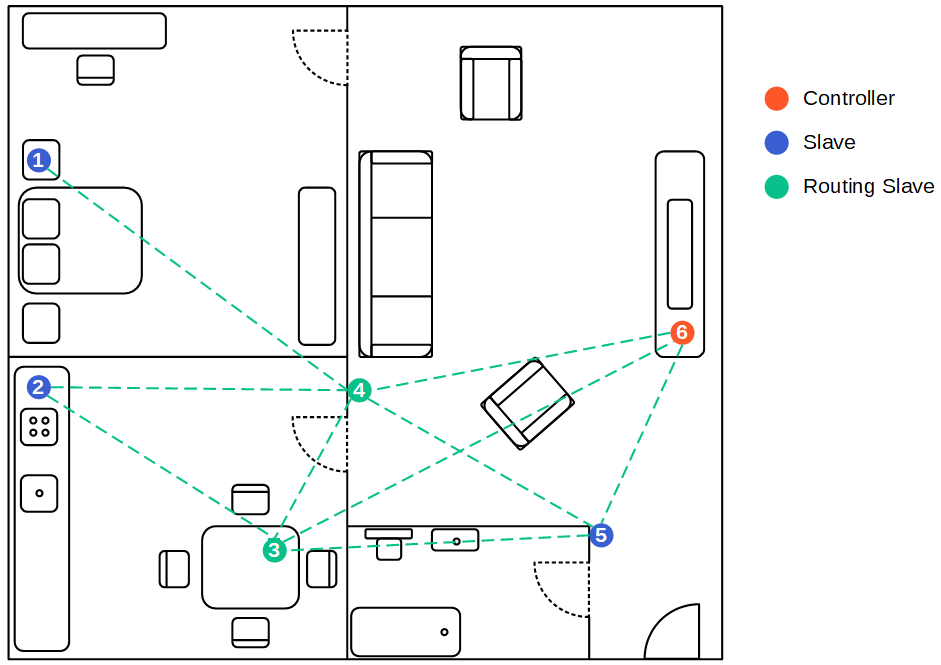
In a mesh network all devices connect directly, dynamically and non-hierarchically to as many other nodes as possible. Therefore a mesh network can span much further then the range of a single unit which is about 100 feet / 30 meters. But note that the longer the distance, the longer will be the delay between the signals and for example a light turns on with a noticeable delay.

For example in the picture above, the slave in the bedroom is not in range of the controller, but a routing slave forwards and repeats messages from the client to the slave. These forwarding can taken place maximum 4 times. Generally all mesh networks are more robust against failing devices because it is possible that all messages take another route in the mesh network. Therefor adding new devices to the network that are able to route information between the nodes strengthens the whole network.

There are three different types of nodes in a Z-Wave network with different functions and permissions that are describes in the following table.

Battery powered devices are not designed to be routing slaves because to forward messages in the network, the routing slaves can not enter sleep mode. This would dramatically decrease the battery lifetime of the device.

A routing table shows the connections between the nodes in the mesh network. The following table shows the routing table for the example Z-Wave network.

Add a new smart device to the network

How are smart devices clearly assigned to a Z-Wave network? There are two different IDs for this purpose.

  1. Network ID: The Network ID, also called Home ID is a unique 32-bit identifier and identifies all nodes in one logical Z-Wave network and is assigned to each device by the primary controller during the paring. The Network ID is assigned to every controller during the factory process. Also if there is another controller that joins the network, the controller inherits the Home ID from the primary controller.
  2. Node ID: The second ID is the Node ID and assigned to each node by the primary controller. The Node ID is only assigned once within the network and has a length of 8-bit.

The following picture shows how a Z-Wave network is build by two controllers and two slaves.

Z-Wave add devices to network

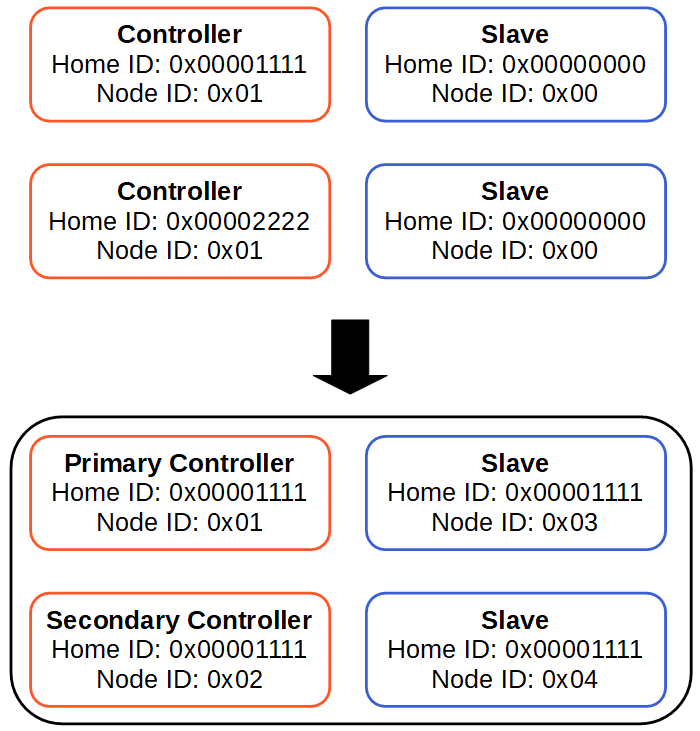
Before the network is created, the controllers have different Home IDs and a the Node ID of 1. The Salves have no Home ID and also no Node ID.
After the primary controller is selected, the Home ID of the primary controller is written to all salves and also the secondary controller. The Node ID is set to a unique address for every slave and controller by the primary controller.

Before a new device is connected to the Z-Wave network, the device has to be pared once. Because the controller of the network measures the signal strength of the new device and optimizes the routing table for the network with the signal strength, the new device should be pared on the final place, where the device will be in the future. Otherwise the routing table will not be optimized and therefore the signal strength and reliability of the network could be decreased.

Z-Wave Radio Frequency

Another advantage of Z-Wave is the used radio frequency. Z-Wave uses different operating frequencies depending on the county or region. But independent of the country the operating frequency is not in the spectrum of WiFi (2.4 GHz / 5 GHz) and Bluetooth and therefore the signal is more reliable.

The following table shows the used Z-Wave radio frequency depending on the country. Also the table shows the residential voltage and the net frequency.

Different Z-Wave Series

During all the years of development on the Z-Wave smart home communication protocol, different series of the hardware chip were released by Zensys (300 series), Sigma Designs (500 series) and later Silicon Labs (700 series).

The 700 series was released in April 2019 and improved the 500 series especially in power consumption and security. The wireless communication of the 700 series uses 64% less power so that the maximum battery live is increased to 10 years.

The 3 optional layers of security that the 500 series offered are now mandatory, making Z-Wave, in my opinion, to the best smart home communication protocol for security related devices.

Also the CPU, in the 700 series is an ARM Cortex and increases the CPU power by 18% compared to the 500 series.

If you want to buy a smart home device that includes the 700 series, make sure in the product specification the Z-Wave Gen7 is listed. One of the first companies that is series 700 certified is Aeotec. The first Gen7 devices from Aeotec are the Range Extender 7 and the Recessed Door Sensor 7.
If you are interested in the technical details of the different Z-Wave series, you find the specifications in the following table.

If you have any questions regarding Z-Wave, smart home communication protocols in general or other questions, leave a comment and I will answer your questions as soon as possible.
And if you are interested in other smart home communication protocols, check out the tutorial for ZigBee and MQTT.

Smart Home

What is a Smart Home

What is a Smart Home?

What makes the difference between a normal home and a smart home? In a smart home, electrical devices can be controlled automatically.

For example you do not have to turn on the heater in the bathroom every morning manually, but you set up an automation that on weekdays the heater is turned on 20 minutes before your alarm clock rings.

Table of Contents

But before your home is completely automated, in my opinion there are two stages to a smart home:

  1. Control smart devices with a mobile device
    In the first stage you have individual smart solutions that are controlled by an app on your mobile phone or tablet or by a smart speaker such as the Amazon Echo or Google Home. In this first stage you are able to remote control a light or preheat your house when you are on the way back from work.
    2. Automate processes to avoid controlling
    In the second and final stage you want to reduce your manual task to a minimum and automate as many processes as you can. Also in the final stage of a smart home all smart devices, independent of the vendor are connected to each other. Therefore you do not have to manually turn on the light but depending on different inputs (time, motion detection, brightness in the room) the smart home decides to turn the light on or off.

The fundamental requirement for all devices in a smart home is to share information between each other and are thus part of the internet of things (IoT).

There are a lot of products on the market which are smart devices. But smart devices do not make a smart home for themselves. The following picture shows a picture of an apartment with different components that make this apartment a smart home.

Smart Home

Modem and Router

The first part which we all should have, otherwise you could not read this article, is an internet connection. Most of us use a modem and router combination from our internet provider to get access to the internet. When we have internet access, we can control the smart devices in our home when we are not at home. But if you do not have the need to control your smart devices when you are not at home, you do not need internet access. When you are at home all your devices and also your smartphone are in the same local network.

Smart Hub

The second device that I recommend when you want to build a smart home with more than 10 smart devices is a smart hub because a smart hub connects different smart devices like a gateway. Therefore smart devices from different companies are able to interact with each other. Also a smart hub enables you to define automation processes via an interface as app on your smartphone for example. There are also devices that do not function without a smart hub because they do not support a WiFi connection. The most sold smart hubs are:

Smart Devices

Of cause you need smart devices that function either as a sensor or as an actor in a smart home system. The smart devices are distributed in the whole smart home and are able to interact with each other or via the smart hub. In most cases the smart device replace your old device. I recommend everyone that wants to buy smart devices to make sure that you have a basic understanding about smart hubs and smart home communication protocols. Otherwise it would be too annoying if your new bought smart device does not communicate with your other devices. One way to avoid this anger is to buy a set or a bundle of smart home devices from one company.

The following list of smart devices gives you an overview about the most used smart home devices aggregated by categories.

Energy Management

  • Smart Thermostat measures the temperature and humidity in the room to control the radiator controller for the heater or the air condition.
  • Radiator Controller gets information about the temperature in the room and if someone is at home to optimize the temperature and also to save money.
  • Weather Service gives you information about the rainfall and other outdoor weather conditions to inform you, in combination with a window sensor, that a window is open and it starts to rain.
  • AC Controls cools the room based on the information from the smart thermostat.

Comfort and Lighting

  • Smart bulbs control whether a light goes on or off based on multiple conditions if the light is automated or via speech control, as well as the brightness or color of the light.
  • Window and door sensors detect if a window or a door is open or closed for security reasons or to get an information that a window is open when it starts raining.
  • Shadowing for sun blinds or roller shutters also for security reasons when the system detects that you are not home or to prevent the smart home from heating up in summer.

Home Entertainment

  • Multi-room entertainment systems to listen to your favorite music on different entertainment systems throughout the house.
  • Smart remotes as alternative to your mobile phone to control different smart devices only with one universal remote control.
  • Streaming devices enable you to watch TV or movies directly from the internet.

Control and Connectivity

  • Smart speakers let you control your smart home devices with your voice and also act as voice assistant for different other smart task like ordering a pizza, play your favorite music or get the weather report.
  • Smart plug is an adapter between your power socket and another electrical device. As a remote switch the adapter can turn the connected electrical device on and off.
  • Control buttons and panels are smart devices to automate and control certain functions in your home.

Security

  • Smart locks open the smart home key less and track the time when a door was open. Also for some smart locks you can create pins that are only valid for a short time to to give the parcel carrier access to the house to drop off the packages (only recommended in combination with security cameras).
  • Smart security cameras monitor the Smart Home outside as well as inside so you can get an idea of the current situation even when you are not in the house.
  • Motion detectors detect movements in the room, for example to turn on a dimmed light at night or to set an alarm if your are on vacation.
  • Smoke detectors not only recognize the danger of smoke, but can also switch on additional alarms as well as all lights in a smart home to get to safety as quickly as possible in case of danger.
  • Flood detectors are triggered by the presence of water and inform you to avoid flooding the house.


Smart appliances are a category of smart devices that are also connected to the smart home like a smart coffee machine that is preheated when you wake up in the morning, a vacuum robots that cleans the floor only when you are at work or a smart fridge that detects missing groceries.

Smart Home Communication Protocols

The last part of a smart home are the communication protocols that connects the different smart devices among each other and / or with the smart hub, depending on the architecture of the network. There are multiple communication protocols available and you have to make sure that if you want to buy a new smart device, the device can communicate with the other devices. Smart devices with the same communication protocol are often able to communicate directly to each other, building a so called mesh network. Devices with different communication protocols can also interact with each other but they need a smart hub as gateway to translate between different protocols and not all smart hubs support multiple protocols.

The most used smart home communication protocols are:

  • MQTT that uses a WiFi communication and that I use most of the time for my DIY smart devices based on an Arduino, EPS8266 or ESP32 microcontroller. Also the standard WiFi connection is used by many smart devices with the disadvantage that the devices can not exchange information and you have to use one app per manufacturer when you do not have a smart hub.
  • Z-Wave as long distance communication protocol from Sigma Designs which is totally standardized. All chips are produced by Silicon Labs and are therefore in some cases more expensive per device but also have the best interoperability compared to all other communication protocols.
  • ZigBee is an open wireless standard and companies can implement their own products based on this standard. Therefore there is no grantee that smart devices from different companies are able to communicate between each other.
  • Bluetooth BLE Mesh is not as widespread as the other protocols, but can also be used for DIY projects because of the low energy use.

Advantages and Disadvantages of a Smart Home

I hope that with this article, you got a good overview of the smart home topics. If you have any questions regarding smart home devices, smart hubs or other questions, leave a comment in the following comment section and I will answer your questions as soon as possible.

Rain Sensor Thumbnail

Rain Sensor Tutorial for Arduino, ESP8266 and ESP32

Rain Sensor Tutorial for Arduino, ESP8266 and ESP32

In this tutorial you learn how the rain sensor is constructed and how the sensor works. In three different examples we build up the wiring and define the program code. If you want to use the rain sensor for a long time, you learn in the last example how to increase the lifetime of the sensor.

You can build this rain sensor into an outdoor weather station.

Rain Sensor Thumbnail

Rain Sensors also called raindrop sensors are very handy sensors that are used in a variety of use cases. Alone a rain sensor can only detect if it is raining and how strong it rains but in combination with other electrical devices you can build useful applications.

For me the most useful application is to detect an open window when it starts to rain because I am often not sure if I closed a window after I left the house.

The rain sensor consists of 2 components, which we consider in more detail below:

  • Rain board to detect if it is raining or not
  • Control board to process the data from the rain board

Table of Contents

Rain Board

The rain board is a printed circuit board in a rectangular shape. The size can differ between models but the construction is the same for each model. The ground plate of the circuit board consists of fiber reinforced plastic that is not conductive. On top of this ground plate there are two pins mounted. From each of these pins starts one conductor track, build like an “E” with an offset against the other conductor track. Therefore the tracks are not connected but the conductor tracks are close together.

Rain Board

You can measure the resistance of the rain board with a multi-meter, like I did. The following two pictures show the rain board in dry condition with an infinite resistance and after I put my finger on the board with a resistance of 3.87 MΩ.

Rain board infinite resistance
Rain board finger resistance

Why is the resistance changing?

The schematic illustration shows the difference between a variety of states for the rain board. With no rain there is no connection between the two copper tracks and the resistance is infinite.

During light rain there are some water drops that land on the surface of the rain board and connect the two conductor tracks. Because water is conductive, the resistance of the rain board decreases resulting in a medium resistance. The same happened when I touched the rain sensor, because my skin is also conductive, connecting both copper tracks.

If there is heavy rain, more and more rain drops falling on the board and further decrease the resistance until the resistance is 0Ω and the circuit is shorted.

Summarizing the rain board: The rain board is a rain depended resistor that has a high resistance when there is no rain and a low resistance when rain drops are on the circuit board. The operating principle is the same as that of a photoresistor.

Now we have to make sure that we can measure the change of the resistance. If your read my resistor tutorial, you know that this can be done with a voltage divider.

Recap of the functionality of a voltage divider

The following picture shows a voltage divider consisting of two resistors. In our case R2 is the resistor of the rain board. R1 is a reference resistor with a known resistance. From the equation you see that if we know the supply voltage U, we can calculate the voltage drop over the rain board.

Voltage Divider explaination

But where do we find the voltage divider? This function has among other things the control board.

Control Board

The control board consists of two input pins and four output pins. The input pins are connected to the rain board and the output pins to your favorite microcontroller, for example an Arduino Uno or an ESP32 NodeMCU.

On the control board you find multiple resistors that also functions are the voltage divider to provide an analog signal for the rain intensity. Therefor as input we get a resistance from the rain board and the control board converts this resistance into a voltage drop between the analog pin and ground. The microcontroller uses the internal analog to digital converter (ADC) to convert the voltage from the analog pin to a digital value between 0 and 1023 that can be printed to the serial output in your Arduino IDE.

The biggest part on the control board is the potentiometer to adjust the sensitivity of the rain detector. The potentiometer is only a variable resistor whose resistance is changed with the setting wheel at the top. We need this potentiometer to compare the resistance of the potentiometer with the resistance of the rain board. If the resistance of the rain board is lower than the threshold, defined by the potentiometer, the digital output of the control board changes from 1 HIGH to 0 LOW.

LM393 High Precision Comparator - Sensitivity Adjustment
LM393 High Precision Comparator - Comparator

But who does this comparison between the two resistances? This is done by the LM393 comparator because the voltage drop over both resistors is linear to their resistance due to ohms law. The LM393 consists of two independent precision voltage comparators and is specially designed to operate from a single power supply, in our case the microcontroller. You find more details about the LM393 on the website of Texas Instruments.

From the following picture you see that the combination of a potentiometer and the LM393 comparator is very often used for different kinds of sensors where you have to convert an analog signal to a digital signal via the threshold of the potentiometer.

potentiometer LM393

The control board has also a build in LEDs that indicates the power status of the board and the status of the threshold. If the digital output of the control board changes from HIGH to LOW, indicating that it is raining, the status LED of the control board turns on.

LM393 High Precision Comparator - LEDs

Wiring between the Rain Sensor and Arduino, ESP8266 or ESP32 microcontroller

The following two pictures shows the wiring between the rain board and the control board as well as the connection between the control board and the Arduino microcontrollers, the ESP32 NodeMCU as well as the ESP8266 based micocontrollers. Because the rain board only connects a resistance to the control board, switching the connection does not have any influence.

If you are missing a microcontroller, please write a comment in the section below this article and I will add more fritzing pictures of the wiring of the rain sensor.

Rain Sensor Arduino Nano

Rain Sensor Arduino Nano

Rain Sensor Arduino Pro Mini

Rain Sensor Arduino Pro Mini

Rain Sensor Arduino Uno

Rain Sensor Arduino Uno

Rain Sensor Arduino Mega

Rain Sensor Arduino Mega

Rain Sensor ESP32 NodeMCU

Rain Sensor ESP32 NodeMCU

Rain Sensor ESP8266 NodeMCU

Rain Sensor ESP8266 NodeMCU

Rain Sensor ESP8266 WeMos D1 Mini

Rain Sensor ESP8266 WeMos D1 Mini

Examples of the Rain Sensor

In the following chapter of this tutorial I want to create in total 3 examples:

  1. Read only the analog value and create a time series chart of the analog value.
  2. Read also the digital value and print the analog and digital value to the serial output.
  3. Bonus: Increase the lifetime of the rain sensor and prevent corrosion.

The following table gives you an overview of all components and parts that I used for this tutorial. I get commissions for purchases made through links in this table.

Arduino Code for Reading only the analog value

In the first example we can use the wiring from the previous chapter but we simply do not print the digital value because only if we print one value, we can use the serial plotter of the Arduino IDE.

// for Arduino Microcontroller
#define rainAnalog A1
#define rainDigital 2

// for ESP8266 Microcontroller
//#define rainAnalog A0
//#define rainDigital D1

// for ESP32 Microcontroller
//#define rainAnalog 35
//#define rainDigital 34

void setup() {
  Serial.begin(9600);
  pinMode(rainDigital,INPUT);
}
void loop() {
  int rainAnalogVal = analogRead(rainAnalog);
  boolean bIsRaining = !(digitalRead(rainDigital));

  Serial.println(rainAnalogVal);
  delay(200);
}

The first step of the Arduino script is to define the analog and the digital pins that connect the microcontroller and the control board. In my case I use the pin A1 for the analog connection and D2 for the digital connection of the Arduino microcontroller as you see in the fritzing sketch of the Arduino Uno.

For the ESP8266 NodeMCU and WeMos D1 Mini and also for the ESP32, the definition of the analog and digital pins differ. They are included in the script but commented. If you use an ESP8266 or ESP32 microcontroller uncomment the lines of code and comment the definition of the Arduino pins.

In the setup function I set the baud rate of the serial connection to 9600 that have to match to the serial output setting of the Arduino IDE to print the values. Also I have to set the digital pin as input because I want to read values at these pin.

In the loop function I create the variable rainAnalogVal as integer and read the analog value from the analog pin with the build in function analogRead(). Then I read also the digital value, with the build in function digitalRead() and convert the logic with the NOT operator because the digital value from the control board is 0 (LOW) when it is raining and for me the logic makes more sense if the boolean variable is 1 (TRUE) if it is raining.

To view the time series chart of the analog rain sensor we print the analog value to the serial output and with a short delay of 200 milliseconds we pause the script at the end before the loop is executed again.

In the Arduino IDE you can now activate the serial plotter under Tools → Serial Plotter and get a time series chart of the rain sensor like the following. You see clearly that the sensor value drops when I touch the rain board with my dry or wet finger.

Rain Sensor Serial Plotter

Arduino Code for Reading the analog and digital value

Now we want also display the digital value. This is super easy. We only have to add three lines of code to the loop function:

void loop() {
  int rainAnalogVal = analogRead(rainAnalog);
  boolean bIsRaining = !(digitalRead(rainDigital));

  Serial.print(rainAnalogVal);
  Serial.print("\t");
  Serial.println(bIsRaining);
  delay(200);
}

After we print the analog value to the serial output we make a tabulator and print the analog value of the rain sensor. In the following picture you see that if the analog value is reduced below a defined threshold through the potentiometer, the digital value changes from 0 to 1.

Rain Sensor Serial Monitor

Bonus: Increase the lifetime of the rain sensor

Due to the current flow and the contact with water, the rain sensor will build rust from electrolysis that damages the sensor and makes the sensor inaccurate. How strong the electrolysis will be depends on three different factors:

  1. the quality of the rain board,
  2. the amount of water on the rain board
  3. how often and how much current is passed through electrodes of the rain board

To increase the lifetime of the rain sensor we reduce the operating voltage from 5V to 3.3V and also only provide voltage to the sensor when we want to read the sensor values with the microcontroller. Therefore we change the wiring and do not longer connect the 5V pin of the Arduino microcontroller or the VIN pin of the ESP8266 and ESP32 based microcontroller to the control board but we connect the microcontroller via the 3.3V pin.

Moreover we do not connect the Arduino, ESP8266 or ESP32 microcontroller direct to the rain sensor, but we use a MOSFET to disconnect the rain sensor completely from the circuit when we do not need to read the analog sensor value. I use the IRLZ44N MOSFET because this logic level MOSFET responds also for low voltages between 2.5V or 5V.

The following picture shows the new wiring with an Arduino Uno as example.

From the fritzing picture you see also that I use an 1MΩ resistor to protect the gate to source from electrostatic discharge.

With this change we reduce the operation voltage to 3.3V and with the digital pin we can control when the digital pin is set HIGH to to turn on the rain sensor and when to set the pin LOW to shut down the sensor.

One downside is that the internal analog to digital converter (ADC) of the microcontroller has 5V as reference voltage and now not the full value range is used for the analog signal. You see the reduced maximum analog value in the last picture of this article.

I also build the digital value based on the analog value in the Arduino script and not by the analog pin of the control board. Therefor I do not have to connect the digital pins.

The following lines show the new script and the changes that we have to make.

#define rainAnalog A1
#define sensorPower 7
boolean bIsRaining;

void setup() {
  Serial.begin(9600);
}
void loop() {
  digitalWrite(sensorPower, HIGH);  // Turn the sensor ON
  delay(10);              // Allow power to settle
  int rainAnalogVal = analogRead(rainAnalog);

  if(rainAnalogVal < 100) {
    bIsRaining = true;
  }
  else {
    bIsRaining = false;
  }
  digitalWrite(sensorPower, LOW);    // Turn the sensor OFF

  Serial.print(rainAnalogVal);
  Serial.print("\t");
  Serial.println(bIsRaining);
  delay(1000ul*60*5); // wait for 5 Minutes
}

The first change we make is to define two new variables:

  • sensorPower defines the new digital pin that connects the control board to the microcontroller.
  • bisRaining is a boolean value that shows if it is raining or not.

The variable for the digital value is deleted in the define block at the beginning of the script and also in the setup function.

In the loop function we turn on the control board by setting the pin of the sensorPower HIGH and let the power settle before we read the analog value. The boolean value is built by a simple if else function. In my example I choose 100 as the threshold but you can choose a different value if you want. After the analog and digital values are calculated we turn off the rain sensor by setting the power pin LOW.

The following picture shows the output of the Arduino script with a maximum analog value of 131 instead of 1023.

Rain Sensor Serial Monitor Power Saving

To prove that there is no current low through the rain sensor, when the MOSFET disconnects the rain sensor from the microcontroller, I measured the voltage between both contacts of the rain sensor and changed the Arduino script that there is a 5 second current flow, followed by a disconnected period of 5 seconds. The following picture shows that the voltage of the rain sensor oscillates between 3.3V and 0V. Therefore we know that the MOSFET circuit is working well.

I hope you liked this tutorial and if you have any questions regarding this tutorial leave a comment below and I will answer your questions as soon as possible.

Home Assistant Dashboard 2

HASS.io Raspberry Pi Setup Tutorial

HASS.io Raspberry Pi Setup Tutorial

In this article I show you the easiest and fasted way to install HASS.io as well as all additional programs on a Raspberry Pi that you need for your smart home.

The programs we need are the following:

  • Home Assistant via HASS.io as overall smart home dashboard to control your smart devices.
  • Mosquitto as MQTT broker to receive data from self build sensors in your home.
  • InfluxDB as database to store MQTT data.
  • Grafana to create time series dashboards based on data in the InfluxDB database.
Home Assistant Dashboard 2

Table of Contents

This article belongs to a series of 5 articles about the setup and use of Home Assistant. The following picture shows how the articles are related to each other

The following table gives you an overview of all components and parts that I used for this tutorial. I get commissions for purchases made through links in this table.

HASS.io installation on the Raspberry Pi

The installation of Home Assistant via the HASS.io image has several advantages but also disadvantages compared to the installation based on Docker. The following table shows these advantages and disadvantages.

The installation of HASS.io is nothing else then installation of Raspbian on your Raspberry Pi. On the Home Assistant website you find the last stable version for your device.

In my case I want to install the operating system on my Raspberry Pi 3 Model B and choose the recommended 32 bit version. If you have a Raspberry Pi Model 4, then you have of course to install the HASS.io version for the Model 4.

Installation Choose Raspberry Pi Image

The download of the HASS.io image starts immediately after clicking on the device. After the download is complete we have to install HASS.io on the SD card. There are several software programs to do this task but Etcher is most used. Etcher is a free and open-source software to write images like .iso or .img file to storage media like USB sticks or SD cards. Download and install Etcher from the official website.

After the installation open Etcher. You should see the following screen.

Etcher

The first step is to select the image. Click “Select image” and select the .img.gz image that you downloaded before. Then you have to select the micro SD card by clicking “select drive”. It is recommended by the developer of Home Assistant to use a SD card with lat least 32 GB to not running out of space.

Etcher SD card

The last step is to click on the “Flash!” button and start the flashing process of the image to the micro SD card. After the flash process is complete you get a confirmation that everything went well

Etcher Complete

Now you insert the micro SD card into your Raspberry Pi and connect the Pi via LAN to your network. It can take up to 20 minutes for HASS.io to be accessible, because the OS is looking for updates and install these updates directly.

To access HASS.io we have to know the IP address of the Pi. Therefore we need an IP scanner software like Advanced IP Scanner which is a free, fast and powerful network scanner with a user-friendly interface. You can download the Advanced IP Scanner from the official website. After installing and starting the software you can scan your local network for active IP addresses. The alternative is to log in to your modem and look for connected devices. In my case the IP address is: 192.168.0.3.

IP Scanner

Initial Setup of HASS.io

Now you can log into HASS.io on port 8123. This is done by typing in the IP address followed by a double dot and the port number on your browser. In my case I connect to HASS.io with: 192.168.0.3:8123.

You should see the signup form where we have to create a user with a name, an username and a password. Choose a name, username and password and click “create account” to get to the next window.

Home Assistant signup

In the next window we define our location, to get automatically location based information on your Home Assistant dashboard like:

  • Time of the sunset and sunrise to create automation processes based on the GPS information, for example turn on a specific light after sunset.
  • Weather forecast information.

With the detect button, your location is searched based on your IP information. But you have to redirect the arrow on the map by moving the map and clicking on your home. Your time zone and the unit system is then set based on your location. If you want to change these settings you can do these also later in the settings of Home Assistant. Click the next button on the bottom of the website to go to the next and last page of the HASS.io setup.

Home Assistant Setup Location

If you have smart devices in your local network, they should be automatically detected by the operating system. In my case I have a Samsung smart TV that is detected. The identification of smart devices in the network is very good and all devices should be found. But if you have devices that are for example self build with the ESP8266 microcontroller, you can add them with the “more” button and the ESPHome integration.

Also other devices that are not found automatically can be added with the IP address of the device. Now click “finish” to get to the HASS.io dashboard.

Home Assistant Setup Devices

You can also visit Home Assistant with your smartphone by visiting the same URL like in your browser. Most smartphones also have the function to add a browser URL to the start screen (like an app) to visit Home Assistant with one click.

Smartphone Home Assistant App
Smartphone Home Assistant

Now you see the Home Assistant dashboard and the initial setup of HASS.io is complete. If you are interested in the general functionalities of Home Assistant then you can visit the Home Assistant tutorial article.

In this article we will now focus on the following topics:

  • Configuration of a static IP address for Home Assistant
  • Setup of Mosquitto as MQTT broker
  • Setup of InfluxDB and Grafana to visualize MQTT data

Configuration of a Static IP Address

Now you could run HASS.io on your Raspberry Pi but you do not have any control over the used IP address of the Raspberry Pi. This is bad because we want to send data from self build weather stations via the MQTT transportation protocol to the Raspberry Pi. If the Raspberry Pi reboots after a problem or an electricity cut, the router gives the Raspberry Pi a new IP address and the weather stations will send the data to an MQTT server that does not exist anymore with the pre-configured IP address. In this case you have to connect every weather station to your PC and change the IP address in the Arduino code.

Therefore we set the IP address for HASS.io to static by creating a configuration USB stick that is connected to the Raspberry Pi. The USB stick has to be formatted as FAT32 and called CONFIG, as you see in the following picture.

HASSio Static IP 1

On this USB stick you create a folder called “network” and create a file called “my-network” by creating a text file and delete the “.txt” ending.

HASSio Static IP 2
In the “my-network” file you put the following code for an LAN connection. You can open this file with Notepad++ for example.
[connection]
id=my-network
uuid=f62bf7c2-e565-49ff-bbfc-a4cf791e6add
type=802-3-ethernet

[ipv4]
method=manual
address=192.168.0.101/24;192.168.0.1
dns=8.8.8.8;8.8.4.4;

[ipv6]
addr-gen-mode=stable-privacy
method=auto
The id and uuid in the connection section do not have to be changed and are defined by Home Assistant. In the ipv4 section you have to change the address to your preferred IP of the Raspberry Pi and the IP address of your router.
HASSio Static IP 3

Now you can save the file and insert the USB stick into one of the USB ports on the Raspberry Pi. In the Home Assistant dashboard you can import the network settings by clicking the button under Supervisor → System → Import from USB. The last step is to reboot the system by clicking on the reboot button next to the import button.

The Raspberry Pi reboots on the new IP address. Therefore you have to close the current window on your browser and open a new one with the new IP address followed by the port 8123. In my case the new address is: 192.168.0.101:8123.

After you see the Home Assistant dashboard again you can remove the USB stick from the Raspberry Pi.

Setup of Mosquitto as MQTT broker

The following setup of the Mosquitto MQTT broker is very easy for the HASS.io installation, because with this operating system, an Add-on store is included. You find this add-on store under the supervisor section of Home Assistant. You find the Mosquitto broker in the official add-ons section.

This supervisor section is not included if Home Assistant is installed via docker.

Supervisor Addon store

Click on the Mosquitto broker button and on the next page you install the MQTT broker via the install button.

Mosquitto MQTT installation

After a few seconds the installation of the Mosquitto broker is finished and you can turn on the auto updater if you want and start the broker with the start button.

Mosquitto MQTT installation 2

The next step is to configure the MQTT broker because we want only defined users with an username and a password that can send and receive data. On the add-on site of the Mosquitto broker scroll to the bottom to see the configuration file. Here we add an username and a password of your choise, like you see in the following picture. If you want to use the username and password that you selected in the signup form during the installation of HASS.io, then you do not change the default configuration.

Mosquitto MQTT config

After Mosquitto is installed and configured, the last part is to integrate the MQTT broker into Home Assistant. Go to the Integrations page (Configuration → Integrations) and you see that MQTT was discovered.

Click on the configure button, select the enable discovery option and submit the selection. Now the Mosquitto MQTT broker is ready to use.

Setup of InfluxDB and Grafana to visualize MQTT data

After we can receive MQTT data with the Mosquitto MQTT broker, we wan to store the data into an InfluxDB database and create visualizations in Grafana like we did in the InfluxDB and Grafana tutorial. Therefore we also have to integrate the two addons for Home Assistant.

Like Mosquitto you find InfluxDB as well as Grafana in the addon store.

InfluxDB Grafana Addon store

The installation is similar to the Mosquitto installation. During the installation of InfluxDB and Grafana you can choose to show InfluxDB on the sidebar, which I recommend to get easy and fast access to the database.

Well done, you have finished the Home Assistant setup via HASS.io on your Raspberry Pi. Now you can add all of your smart devices and take your time to play with Home Assistant.

If you want to know how to show MQTT data from a self build weather station in Home Assistant and also in Grafana, then I recommend to read the Home Assistant tutorial.

If you have any questions regarding this tutorial or if you have problems setting up the Home Assistant environment, leave a comment in the following comment section and I will answer your questions as soon as possible.

Docker Home Assistant

Raspberry Pi Home Assistant Docker Setup

Raspberry Pi Home Assistant Docker Setup

In this tutorial you learn how to install Home Assistant through Docker for your Raspberry Pi.

For a full smart home system you need some additionally applications alongside Home Assistant. Therefore this tutorial includes the following installations via Docker:

  • Home Assistant as overall smart home dashboard to control your smart devices.
  • Mosquitto as MQTT broker to receive data from self build sensors in your home.
  • InfluxDB as database to store MQTT data.
  • Grafana to create time series dashboards based on data in the InfluxDB database.
Docker Home Assistant

Table of Contents

This article belongs to a series of currently 5 articles about the topic Home Assistant. The following picture shows how the articles are related to each other.

The following table gives you an overview of all components and parts that I used for this tutorial. I get commissions for purchases made through links in this table.

In my opinion, the installation of Home Assistant via Docker on the Raspberry Pi is the more advanced way of using Home Assistant because this installation method allows you to run more applications or use cases on the same Pi.

Before we start with the setup let us look for the advantages and disadvantages of this installation method compared to the installation of Home Assistant via HASS.io.

In our case, we want to run Home Assistant on a Raspberry Pi in a Docker container. In this tutorial I assume that you already installed Raspbian Buster on your Pi. If you are not familiar with the initial setup of the Raspberry, then this tutorial of the headless Raspberry Pi setup is the right for you. I recommend to install Raspbian Buster Lite because we do not need the graphical user interface but only the command line. The following part of the tutorial expect that your have Raspbian installed, an internet connection and SSH activated.

Docker on the Raspberry Pi

In this article is not a docker guide because there are already very good articles about docker in general. But I will summarize the fundamentals of docker that you understand why we use it.

Docker is a set of platform as a service (PaaS) products that enables the isolation of applications through container virtualization. A container is an isolated image of software, libraries, configuration files and any other data to run the container application. Container can communicate with each other through predefined channels and also with the main operation system to load a predefined configuration for example. The main advantage of docker compared to virtual machines is that all containers are run by a single operating system kernel. This ensures that all resources are used at the best.

In our smart home use case, we use the Raspberry Pi as infrastructure of Docker with Raspbian Buster Light as host operating system. Between the operating system and the containers where the applications are running is Docker responsible for the creation, deletion and management of images and containers.

Because the Raspberry Pi is based on the ARM architecture, not all Docker images will work. You find all images on the Docker Hub website that allows the filtering of all images based on the architecture. For the Raspberry Pi we choose only the ARM architecture and not ARM 64 because Raspbian Buster is compiled as 32-bit operating system and not able to run 64-bit applications.

Docker Hub ARM architecture

Before we can start downloading images and creating containers, we have to install Docker. Login on your Raspberry Pi via SSH or open the command line interface. The installation of Docker is done is two steps:

  1. Download the Docker installation script
  2. Execute installation script
Docker installation

From the picture we see that Docker version 19.03.8 is installed. Now we have our foundation to install the applications:

  • Home Assistant
  • Mosquitto MQTT broker
  • InfluxDB
  • Grafana

Before we start you find the most used command line functions regarding Docker in the following table.

Install Home Assistant via Docker

From the official Home Assistant website we get the full installation command

docker run  --init -d  --name="home-assistant" -e "TZ=America/New_York" -v /home/pi/homeassistant:/config  --net=host homeassistant/raspberrypi3-homeassistant:stable
Docker Home Assistant

With the command you see that your Home Assistant Docker container is running with the container name home-assistant.

docker container ls -a
Docker Home Assistant container

Now we can open Home Assistant in the browser on port 8123 of the Raspberry Pi. In my case the Raspberry Pi has the IP 102 and I start Home Assistant in the browser by starting the URL: 192.168.0.102:8123. Now you see the signup form of Home Assistant where you can define your name, username and password.

Home Assistant signup

To get location based information you have to select your housing location on the following map. With the use of your IP address your location is guessed when you click on the detect button. You can then redirect the map to your exact location. The timezone and the unit system are automatically set to your location but if you prefer other setting you can change them.

Home Assistant Setup Location

On the next and also last page of the Home Assistant setup you can choose different smart devices in your home. If you have for example smart plugs, smart light bulbs or a smart TV that is turned on, you should see them in the current setup page like my Samsung TV is automatically recognized by Home Assistant.

Home Assistant Setup Devices

But you can also add smart devices manually by clicking on the more button and add the devices by their IP address in you local network.

Now you can finish the Home Assistant setup and you see the Home Assistant dashboard. If you are familiar with the HASS.io installation of Home Assistant you maybe miss something because the HASS.io installation as operating system for the Raspberry Pi comes with a Supervisor button on the left sidebar.

Home Assistant HASSio vs Docker

This allows you so make snapshots of the system to save configurations and to restart or shutdown Home Assistant. In our case because we run Home Assistant in a Docker container, we can save the configurations and reboot or shutdown Home Assistant via the Docker application.

One main advantage of the HASS.io installation is the integrated add-on store to install compatible applications. In our case also want to install Mosquitto MQTT boroker, InfluxDB and Grafana but we have to create a new docker container for each of this applications.

Install Mosquitto via Docker

To receive MQTT data in Home Assistant we have to install an MQTT broker. In this tutorial I use the most frequently used MQTT broker Mosquitto. To find the Docker image of Mosquitto, we search for the application on the Docker Hub website.

On the right side we see that the image can be pulled via the command.

docker pull eclipse-mosquitto
Docker Mosquitto

Before we can start the container we want to share useful information between the host system and the Docker container. This is important because we want to define an individual configuration for Mosquitto that should be loaded at the creation of the Mosquitto container.

First we create the following folders under a mosquitto folder in your default directory: config, data and log.

Mosquitto tree

In the config folder we create a file called mosquitto.conf with the following command.

nano config/mosquitto.conf

The configuration file has the following context.

pid_file /var/run/mosquitto.pid

persistence true
persistence_location /mosquitto/data/

log_dest file /mosquitto/log/mosquitto.log
log_dest stdout

password_file /mosquitto/config/mosquitto.passwd
allow_anonymous false
Mosquitto config
Now we have to make sure that Mosquitto as a Docker container get the permission to access these folders. This is done by the chown command that stands for change owner. We use the following command to get Mosquitto access to the mosquitto folder via port 1883.
chown -R 1883:1883 ~/mosquitto
Now we can create and start the Mosquitto container with the following command.
docker run -it -p 1883:1883 --name mosquitto -v ~/mosquitoconfig -v ~/mosquitto/data:/mosquitto/data -v ~/mosquitto/log:/mosquitto/log eclipse-mosquitto
  • -it: create an interactive bash shell in the container.
  • -p: define the published ports to the container. We match port 1883 of the host to port 1883 of the container.
  • --name: gives the container a custom name to stop and restart the container by his name.
  • -v: bind mount volumes between the host system and the container. The left side of the “:” defines the path of the host system and the right side the path in the container.
  • -d (not used): Run the container in the background so that the console is free.
At this time we can run the Mosquitto container but we do not have defined any username or password. Therefore we have to access the command line of the container and need the container ID:
  • Lookup the container ID in my case 5e2ec35d975b:
    sudo docker container ls -a
  • Access the shell of the container:
    docker exec -it 5e2ec35d975b sh
With the following command we create a new user (in my case: cdavid) and set a password that we have to confirm a second time.
Mosquitto Password

If we now look at the folder structure, there is a new data called mosquitto.passwd in the config folder that stores the username and password.

Mosquitto tree Password

The password of this data is encrypted for security reasons, like you see in the following picture.

Mosquitto Password file

This was the hardest part of this tutorial and also costs me some time and also a lot of research and failures. After the MQTT broker is setup with an username and password, we continue our work by setting up a container for InfluxDB and Grafana.

InfluxDB Setup via Docker

When we search on Docker Hub for InfluxDB we find the official image that we can pull by:
docker pull influxdb
Now we want also to share the volumes between the host and the container for InfluxDB. Therefore we create a new folder called influxdb. To start InfluxDB you only have to call:
docker run --name influxdb -p 8086:8086 -v influxdb:/var/lib/influxdb influxdb

Grafana Setup via Docker

You find the Grafana image on the Docker Hub under the name grafana/grafana and you can pull the image with the following command:
docker pull grafana/grafana
To start Grafana use the following command:
docker run -d --name=grafana -p 3000:3000 grafana/grafana
After the container is running, you can access the Grafana application on port 3000 with your browser, in my case: 192.168.0.102:3000. At the end of this tutorial you should have to following Docker containers running.
Docker container all

In this tutorial I want to focus on the setup of all Smart Home components like Home Assistant, Mosquitto, InfluxDB and Grafana as Docker containers. If you want to push data from the MQTT broker into InfluxDB and visualize the date in Grafana, then visit my InfluxDB and Grafana tutorial, were I show you step by step how to get the data funnel working. In this tutorial you will see that you also need a Python application that functions as an MQTT bridge. This MQTT bridge is a subscriber to all MQTT topics and pushes the data into the InfluxDB database.

If you have any questions regarding this tutorial or if you have problems setting up the Home Assistant environment, leave a comment in the following comment section and I will answer your questions as soon as possible.

Home Assistant UI 4

Home Assistant MQTT Tutorial

Home Assistant MQTT Tutorial

In this tutorial you learn how to use Home Assistant in general and especially with MQTT data.

Moreover we save the MQTT data in an InfluxDB database before creating beautiful time series dashboards with Grafana.

Table of Contents

Home Assistant is an open source house automation software that combines nearly all of your smart home devices in one system. With the help of Home Assistant you can control and automate devices that are not compatible on their own. Home Assistant runs on different systems like your Raspberry Pi or local servers like a Synology Nas.

There are in total 1574 (retrieved: 11.04.2020) integrations for Home Assistant. The most used are:
Amazon Alexa, Ecobee, ESPHome, Google Assistant, Google Cast, IFTTT, IKEA TRADFRI, MQTT, Philips Hue, Plex Media Server, Smartthings, Sonos, Z-Wave, Zigbee Home.

Generally there are two different ways how to setup Home Assistant. The first one is to install HASS.io on your Raspberry Pi as operating system. Therefore Raspbian Buster is not installed on the Pi. The second way is to install Home Assistant via a Docker container.

For this tutorial I assume that you have Home Assistant running and also installed the following addons either via docker or the internal add-on store of Home Assistant:

  • Mosquitto MQTT broker
  • InfluxDB
  • Grafana

If you still have to install all the programs, no problem. There are in total 5 article in this series as the following picture shows. You can easy switch to one article and come back later.

The following table gives you an overview of all components and parts that I used for this tutorial. I get commissions for purchases made through links in this table.

But for a smart home system, Home Assistant is not the only tool that we want to use. We also need an external MQTT broker to receive and send MQTT messages because the embedded MQTT broker of Home Assistant is deprecated. In this tutorial we use Eclipse Mosquitto as lightweight open source MQTT server.

In Home Assistant you can view measurements like temperatures as time series charts but in my opinion these charts are not very beautiful. Also the raw data is only saved for a certain time and not persistent. Therefore we use the combination of InfluxDB to store all MQTT measurements and Grafana to create beautiful time series charts. I also used InfluxDB and Grafana without Home Assistant to display MQTT data in this article.

MQTT Weather Station

To work with MQTT data in Home Assistant we first need an MQTT client that sends data to the Mosquitto MQTT broker. If you do not know what MQTT is or how MQTT works, there is also an MQTT tutorial. In a previous tutorial I build an indoor weather station that measures the temperature, humidity and the intensity of the light and sends there measurements every minute via the MQTT protocol to a Raspberry Pi with Mosquitto installed as MQTT broker. In my opinion it does not make any sense to copy the article here again. Therefore if you do not already have an MQTT client, you can build the same indoor weather station like I did in this article.

In the Arduino script you only have to make sure that some of the constants are the properly set like you see in the following table:

Show MQTT Measurements in Home Assistant

Before we start to visualize the MQTT data in Home Assistant, we have to make sure that the data from the weather station is received from Mosquitto. In Home Assistant there is an easy way to listen to a specific MQTT topic. Under the sidebar section Developer Tools you find the MQTT application were you can temporary subscribe to a MQTT topic. In my case I defined a topic in the Arduino code of the weather station: home/bedroom/temperature. When I insert this topic and click on the start listing button I see that Home Assistant is able to receive the messages from the MQTT client.

MQTT listen topic

Now we need to configure Home Assistant that the system is continually listen to one or more MQTT topics. Therefore we have to change the configuration file of Home Assistant. The easiest way is to install another add-on in the add-on store called “File editor”. This application let you access and change all files on the Raspberry Pi. Enable the option to view the file editor in the sidebar.

File editor 1

Now we can access the file system over the sidebar and change the configuration file of Home Assistant. You have to click on the folder button on the top and select the configuration.yaml file.

File editor 2
File editor 3

In this file we add a sensor section where we add all sensors independent of the platform. In our case we define that the sensor is an MQTT sensor with the previously defined topic. Then the sensor gets a name and we define the unit of the measurement because MQTT transfers the data as string without a unit.

At this point of the tutorial I give you a bonus: We will not only add the temperature of the weather station but we add also the temperature of the CPU and GPU of the Raspberry Pi and also the clock speed.

Therefore we add the following snippet to the configuration file:

sensor:
    - platform: command_line
      name: CPU Temp
      command: "cat /sys/class/thermal/thermal_zone0/temp"
      unit_of_measurement: "°C"
      value_template: "{{ value | multiply(0.001) | round(1) }}"
    
    - platform: command_line
      name: GPU Temp
      command: "/opt/vc/bin/vcgencmd measure_temp"
      unit_of_measurement: "°C"
      value_template: '{{ value | regex_findall_index("=([0-9]*\.[0-9]*)", 0) }}'
    
    - platform: command_line
      name: CPU Clock
      command: "/opt/vc/bin/vcgencmd measure_clock arm"
      unit_of_measurement: "MHz"
      value_template: '{{ value | regex_findall_index("=([0-9]*)", 0) | multiply(0.000001) | round(0) }}'
      
      
    - platform: mqtt
      state_topic: 'home/bedroom/temperature'
      name: 'Bedroom Temperature'
      unit_of_measurement: '°C'
Home Assistant configuration sensor

Then we save the file and restart Home Assistant via Configuration → Server Controls → Restart.

There are multiple ways to configure sensors in Home Assistant. If you want to dig deeper into this topic I recommend to read the documentation of Home Assistant.

Normally the new sensor data should appear automatically on the overview dashboard. But you can also customize the dashboard with the new added measurements. Click on the three little dots on the top right on the overview screen and select “Configure UI”.

Home Assistant UI 1

Now you can add new dashboards, add measurement and customize the layout. When you click again on the three little dots you see the button where we can see all unused entries. Click on that button to view all entries that are currently not displayed on the dashboard.

Home Assistant UI 2

You should see the measurements that we added before in the sensor part of the Home Assistant configuration file. In my case I want to plot the temperatures in a chart. You can select one or more unused entries and click on the orange + button on the lower right corner of the screen. Now based on our decision Home Assistant knows what measurements we selected and we get a recommendation how to display these measurements on the dashboard. You can directly add the measurements to the dashboard with the button “Add to Lovelace UI” or you can pick a different card.

Home Assistant UI 3

In my case I want to select another card and from the selection of different visualizations I select the history graph. When you click on a card you get more options as you see in my case for the history graph. I can remove or add entities, select a title and define how many hours in the past, the graph should show values. To see a preview of the visualization is a very nice feature of Home Assistant.

When you hit the save button, you see the new card on the dashboard.

Home Assistant UI 5

Insert MQTT Data into an InfluxDB Database

Now we not only want to display the temperature of the weather station in Home Assistant, but we want to save the data in InfluxDB. To save data in the database we have to do the following 3 things:

  • create a database where the MQTT data is stored in
  • define a user with an username and password that can access the database
  • grant this user access to the MQTT data in Home Assistant

Create a database
First we create a database in InfluxDB. Therefore go into InfluxDB via the sidebar and go into the Admin section.

InfluxDB 1

In this admin section we crate a new database called homeassistant.

InfluxDB 2

Create a new user for the database
In the same section we create a new user with the username homeassistant and a password. In my case I also use homeassistant as password.

InfluxDB 3
InfluxDB 4

It is important to grant the new user all permissions to write data into the database.

InfluxDB 5

Access the MQTT data in Home Assistant
To access the MQTT data in Home Assistant we have to change the configuration file again with the file editor. We add the following lines to the configuration.yaml file:

influxdb:
  host: localhost
  port: 8086
  database: homeassistant
  username: homeassistant
  password: homeassistant
  max_retries: 3
  default_measurement: state
  include:
     entities:
        - sensor.Bedroom_Temperature
InfluxDB 6

Because we installed InfluxDB on the same Raspberry Pi, the host is local → localhost. The port of all databases is always 8086 and we set the name of the database and user to homeassistant. If you choose an other password, you have to change it. In the include section we can define the entries that we want to save in the homeassistant database. In this tutorial I choose only to save the temperature of the weather station. If you choose a name for the sensor entry with a blank space, you have to replace the blank space with an underscore.

Now we have have to make sure that the measurements are saved into the InfluxDB database. Open InfluxDB again and go into the explore section. In this section you can submit SQL queries to the database. Of course there are more features but in this tutorial we only want to make sure that the data is saved and accessible by Grafana.

With the following SQL query you can see that there is already data saved in the database:

SELECT * FROM "homeassistant"."autogen"."°C" WHERE "entity_id"='bedroom_temperature'

Visualize MQTT Data in Grafana

When you start Grafana the first time you have to enter the combination of username and password:

  • Default username: admin
  • Default password: admin

The first thing we have to do is to add a data source.

Grafana 1

There are a lot of different possibilities to add data to Grafana. In our case we select InfluxDB.

Grafana 2

Now we have to define the settings for Grafana to access the InfluxDB database:

  • URL: The URL is the IP of your Raspberry Pi and the Port 8086 of InfluxDB. (Note: localhost does not work for me)
  • Database, User and Password: The same settings as in the Home Assistant configuration file.
  • HTTP method: We want to use the get function to query the database.
Grafana 3

At the bottom of the page you can save & test your settings. When everything works well we go back to the home screen and create a new dashboard.

Grafana 4

We choose a new query and now we can define queries either by the graphical interface or by the text editor mode. In my case I choose from all temperatures only the bedroom_temperature as value. To get the view as time series I select that the data should by grouped by the interval time and between the data points in the database there should be a linear interpolation.

Grafana 5

I get the same result when I would use the text editor with the following query:

SELECT mean("value") FROM "°C" WHERE ("entity_id" = 'bedroom_temperature') AND $timeFilter GROUP BY time($__interval) fill(linear)

Now I can save the visualization and see the chart on the Grafana dashboard. You can change the title of the chart or the color. There are a lot of options to play with the data. Just try something out but my tutorial finishes at this point because we have everything you need for your smart home up and running.

If you have any questions regarding this tutorial or if you have problems setting up the Home Assistant environment, leave a comment in the following comment section and I will answer your questions as soon as possible.

Nextion Display Thumbnail

Arduino Nextion Display Tutorial

Arduino Nextion Display Tutorial

In this tutorial you learn everything you need to know about the Nextion displays and the differences in the display series.

I show you how to create an interface in the Nextion Editor and how to use the internal programming functions.

This article also contains a basic example to learn the foundations of the display and the interaction with the Arduino microcontroller. An advanced example shows more complex functions of the Nextion displays.

Nextion Display Thumbnail

Table of Contents

Nextion is a Chinese company which build, in my opinion, the best HMI (Human-Machine-Interface) displays for DIY microcontroller projects. All of their displays have a touch panel and an onboard processor (MCU) combined with onboard memory. That is why the functions of the Nextion display far exceed that of a normal display. Also the displays has an UART connection, that enables the displays to communicate with all microcontrollers (e.g. Arduino, ESP8266) or single-board computers (e.g. Raspberry Pi).

But why has the Nextion display additional memory onboard?
The display needs all this memory because you can store data directly on the display itself like a background image and you are able to program the display directly without any microcontroller. For example if I push a button, the text and the color of the button should change. Flash memory is used to store different fonts, videos and pictures.

The following table shows the different technical specifications of the Nextion display compared to the ESP8266 NodeMCU V2 and the Arduino Uno regarding computation power and memory size.

3 Different Nextion Displays

Nextion builds 3 different display series: Basic, Enhanced and Intelligent. All three series have the touch function as well as integrated flash, RAM and a MCU. If you order a display, no matter what series, a power supply board (Micro-USB to 5V GPIO) and cables to connect the display are included.

The basic series has everything you need for most projects. The smallest display in the basic series has a 2.4” display and costs $16.4 and the biggest display has a size of 7.0” and costs $74.9.

If you buy a display from the enhanced series you get a more powerful hardware compared to the basic series in terms of MCU, flash storage and SRAM. Moreover the enhances series has an integrated real-time-clock (RTC) module onboard to keep accurate time and EEPROM to store values or strings to the memory of the display during the run-time.

The enhanced models not only have the connection to your microcontroller, but also 8 additional digital pins, of which 4 are PWM capable. These additional pins are used with an Nextion expansion board that includes 6 buttons, 1 LED and 1 piezo buzzer. With the combination of enhanced display and expansion board, you can make basic projects without a microcontroller. In this case you have to program the logic in the display MCU which I also show you in this tutorial. The following picture shows you the difference if you use the expansion board or a microcontroller. The picture is only a schematic sketch and the wiring is not correct.

Nextion display without an expansion board

without expansion board

Nextion display with an expansion board

with expansion board

The intelligent series supports all functions of the enhanced series like the RTC module but also has a much faster MCU build in and also 128MB flash. This allows the intelligent displays to support functions like playing videos and animations, audio support as well as PNG support for pictures. Also the intelligent displays have an anti-aliasing gauge to smooth otherwise jagged lines or textures by blending the color of an edge with the color of pixels around it.

There are multiple objects like a switch component that are only usable for this series. An overview of all components that you can add to your interface is provided in the next chapter of this article.

In each series there are different display sizes available. The following table shows the three different series of displays and the technical specifications. In this tutorial I use the NX4832T035 from the basic series, that have a 3.5” display.

R – Touch screen type: R = resistive touch, C = capacitive touch

The following table gives you an overview of all components and parts that I used for this tutorial. I get commissions for purchases made through links in this table.

Building Interfaces with the Nextion Editor

Now we want to know how to build a HMI with the Nextion display. This is done by the Nextion Editor, a free GUI (graphical user interface) development software. You can download the latest version of the software on the Nextion website.

When you start the editor you see the same panels like the following picture. The difference is, that I already created a project to show you the content of the different panels.

The first thing we want to do is to create a new project. The following steps guide you through is process.

  1. First we click the New button on the Toolbar and select a folder where to save the project.
  2. A new window opens and you have to select your display. First you select the series: Basic, Enhanced or Intelligent and then the size of the display. Hint: On the site of the package where the display was in, you find the corresponding number like: NX4832T035 in my case.
  3. Then you can select the display direction: vertical or horizontal and confirm all setting by pressing the OK button.

After we create the project you have to know the basic functions of the Nextion Editor. From the picture above you see that there are 8 planes that are described in the following section:

Main Menu: In the Main Menu you find standard options and settings. For example you can open, save and close projects, find the general settings and look for updates.

  • In the tools category you can add new fonts with the font generator. In the generator you can choose from different fonts and select the height. It is useful to create more than one font for your project.
Nextion Editor Font Generator

Toolbar: In the Toolbar you can also open, save or create a new project. In the second line there are multiple functions to align the components of the toolbox. Also you find other functions that we will use:

  • Compile: Before you transfer the project to the display you have to compile the current code.
  • Debug: The debug window is a good option to check how to display will look like. Also you can check implementations that are programmed directly on the display.
Nextion Editor Debug

Toolbox: In the toolbox are all components that you can add to your project. By clicking on a component it is added to the design plane. There are some advanced components that are only available for the intelligent series. The following picture shows what components are available for the different series of displays.

Nextion Editor Toolbox

Resource Plane: In the resource plane you add pictures, fonts as well as video and audio data that is included in the program files.

Event Code: In this section you can define program code that is executed when a component is used. For example you can define what should happen when a button is pressed and what should happen when this button is released.

Toolbox Plane: In the toolbox plane you define the attributes of the selected component. These attributes are separated into two categories:

  1. Can change at run time
  2. Cannot change at run time

The following pictures shows which attributes belong to which of the two categories. The most important attributes which are also needed for the Arduino program code are the “id” and the “objname”.

Nextion Editor Toolbox Plane

Page Plane: With the Nextion displays you can create virtual pages where you can show different information. You HMI needs at least one page that is added when you create a new project. Also you can export and import pages so save time and reuse different kind of pages.

Design Plane: The design plane is your main window where you layout the interface with different components that you add with the toolbox.

If you want full detailed information about all features of the Nextion Editor, you can visit the editor guide.

The following video shows how I create a new project for my display and add a font as well as some components.

In the video you see the following steps that I make. These basic steps help you to get your first interface running.

  1. I created a new project and save the project on my disk.
  2. After the project is created, I choose the right display model and the select the display direction.
  3. In the resource plan I could add a previous created font but I wanted to create new new one via the Font Generator in the setting menu bar.
  4. The created font is saved to the disk and added to the current project.
  5. For this example I create a text field and changed the text and the maximal text width from 10 to 30. If I had not created a font previously, then I would get an error message.
  6. I created also a button and set the text to button, how creative 🙂
  7. The last step is to check if everything is running in the debugger.

How to get the interface from the Nextion Editor to the display?

The short answer would be via a micro SD card, but in reality it was a little bit trickier. The basic requirement for the Nextion display is that the SD card has to be in FAT32 format. First I tried to use a 64 GB micro SD card but unfortunately when I tried to format the card in Windows 10 there was no option to format the 64 GB micro SD card to FAT32.

SD Card Format
SD Card Format details

Also I tried to format the SD card via the windows PowerShell but this did not work either and I don’t wanted to install a third party application only to change the format of the SD card once.

But I was lucky that I found a 32 GB SD card and the formatting via the PowerShell worked this time with the command: format /FS:FAT32 E: (E is the name of the volume of the SD card)

SD Card Format PowerShell

After the SD card is ready we have to compile our code to make sure that the compiler does not find any errors. You find the compile button ins the Toolbox and the output of the compiler in the output box at the bottom left in the Nextion Editor.

Nextion Editor Compile 2

The next step in the Nextion Editor is to export the TFT file to the micro SD card. Click on File in the main menu and select TFT file output. Now you choose your FAT32 formatted micro SD card and export the file to the card. If you wish, you could check if the TFT file is on the SD card.

Nextion Editor TFT output 1
Nextion Editor TFT output 2

The last step is to place the SD cart into the SD card slot of your Nextion display. After powering the display up, you see that the display recognizes the SD card and loads the file in the internal memory of the display.

Nextion Display Upload TFT

Now you disconnect the display from the power source and remove the sd card after transferring the .tft program.

The next step is to prepare the Arduino IDE to enable the connection between the Arduino or ESP8266 based microcontroller and the Nextion display.

Arduino IDE preparation for Nextion Displays

Good news: the Nextion developers created a library for Arduino and Raspberry Pi that makes the coding much easier. The bad thing is, that this library is not included in the Arduino IDE library search. Therefore we install the library manually in 4 steps:

  1. Download the Arduino library for Nextion Display as ZIP file from the official github repository to a local folder of your choice.
  2. Go to your download folder and unzip the zip file. You should get a folder named: ITEADLIB-Arduino-Nextion-master
  3. Rename this folder to: ITEADLIB_Arduino_Nextion.
  4. Move the ITEADLIB_Arduino_Nextion folder to your Arduino IDE installation libraries folder. If you do not know how your library folder is located you can search for Arduino/libraries and will find the folder, see the following picture.
Arduino Libraries Folder

The Nextion library is configured for the Arduino Mega. If you use the Arduino Mega for this project, you can skip the next step. But if you use for example an Arduino Uno, like me, we have to change the configurations of the library because the Arduino Mega has two hardware serials and the Arduino Uno for example only one.

In the library folder open the NexConfig.h file and change the following three lines:

  • Line 27: comment line with //
  • Line 32: comment line with //
  • Line 37: change Serial2 to Serial

Now everything is setup and we can create our first basic example. After the basic example I show you a more advanced example where we also use the program function of the Nextion display itself.

Basic Nextion Example – Increase Counter

The first example is an easy basic example where you learn how to add buttons and use a number field to make a counter with a reset button. This example has only one page to keep it simple. If you are new to the Nextion display, this tutorial is right for you, but if you are already advanced, you can jump to the next example where I show you a more complex example.

You can download every file I use in this example with the following download button. You download a zip file that includes the Nextion Editor TFT file, the used fonts, a picture and the Arduino script.

If you have not already started your Nextion Editor, you can open it now. Like in the video I showed you at the beginning of this tutorial, the first step in a new project is to select your Nextion display and select the horizontal or vertical display direction. In the second step you can create one or more fonts for this project. I created two fonts, one with a height of 16 and the second with a height of 32 to display text a little bit bigger.

I also want to display a picture in the display. Therefore I select picture in the resource plan and with the red plus sign I added the logo of the DIYI0T bog as picture. To display the picture on the display, I choose picture in the toolbox to add a picture frame to the interface. Now you have assign the right picture ID to the frame. Therefore set the pic setting in the toolbox plane to 0.

I also add all other components that we need from the toolbox:

  • 1 text field
  • 2 buttons

Let us summarize all components of this project in the following table. If your ID is different, it does not matter, but you may have to change the Arduino script which we discuss later in this tutorial.

To change the shown text for the two buttons, we click on a button and in the toolbox plane under txt we set the text to “+” and “Reset”.

Now comes the most important part of this example. We have to make sure that the Arduino is informed via UART when the two buttons are pressed. Generally there are two options when the display sends the signal to the Arduino:

  • The button is pressed: Touch Press Event → PushCallback
  • The button is released: Touch Release Event → PopCallback

Depending on your selection of this option, also the Arduino code will change. I explain the changes in the programming part. I want to inform the Arduino when the button is pressed. Therefore I checked the checkbox “Send Component ID” in the event code of the buttons that you see in the following picture.

example 1 TouchPressEvent

Now everything should work correct and we check the output with the debugger. You should have an interface like the following picture.

example 1 debug

The following picture shows the UART connection between the Nextion display and the Arduino Uno which I use for this example. In this project the power supply is provided via micro USB and the Power Supply Test Board which is part of the Nextion package.

After the interface is loaded to the displays and all parts are connected, we create the Arduino script.

#include "Nextion.h"

// Nextion Objects
// (page id, component id, component name)
NexButton b0 = NexButton(0, 1, "b0");
NexButton b1 = NexButton(0, 2, "b1");
NexNumber numberbox = NexNumber(0, 4, "n0"); 

// Register objects to the touch event list
NexTouch *nex_listen_list[] = {
  &b0,
  &b1,
  NULL
};

//Increase the number
void b0PushCallback(void *ptr) {
  uint32_t number;
  numberbox.getValue(&number);
  number++;
  numberbox.setValue(number);
}

//Reset the number
void b1PushCallback(void *ptr) {
  uint32_t number;
  numberbox.getValue(&number);
  number = 0;
  numberbox.setValue(number);
}

void setup() {
  Serial.begin(9600);
  //Initialize Nextion Library
  nexInit();

  // Register the push/pop event callback function
  b0.attachPush(b0PushCallback, &b0);
  b1.attachPush(b1PushCallback, &b1);
}

void loop() {
  //When push/pop event occured execute component in touch event list
  nexLoop(nex_listen_list);
}

Like in every other script, the first thing we have to do is to include all the libraries we need. For this example we only need the Nextion library. Then we define the Nextion objects based on the added components in the editor. The logic to add an object is the same every time, which shows the following table.

  • Object: The object is the library name of the Nextion component that you added to your editor. For example the button component of the editor is the NexButton object. You simply add “Nex” in front of the component.
  • Object Name: You can choose the object name that is used to call the object in later stages of the script.
  • Page ID: The ID of the page, the component is located in the editor.
  • Component ID: The ID of the component that you can look up in the toolbox plane.
  • Component Name: The name of the component that you can also look up in the toolbox plane.

The following table shows the matching between the component of the Nextion Editor and the object of the Nextion Arduino library.

The next part in the script is to create a touch event list called nex_listen_list to define what objects trigger an event. In this example we include the two buttons and also NULL is included every time to this list.

Now for each element of the nex_listen_list, we have to create a function, that is called when the event for this object is triggered. The first function we create is the function for b0 that increase the number of the display. I like to give my functions a predefined structured name. That is why I call the function b0PushCallback.

The function is called for the b0 object and in the Nextion Editor we defined that the component should have a touch press event and not a touch release event. The touch press event is the push callback and the touch release event would be a pop callback.

Inside the function, the logic of the script is pretty easy. First we create a variable number. Inside this variable we store the current value of the numberbox object which is the displayed number in the number component. The function to read the number is getValue. After we increased the variable, the value of the number component is set to the increased variable with the setValue function.

The function for the second button b1 is nearly the same. The only difference is that we do not increase the variable, but we reset the variable to 0.

After the two functions are defined, we create the setup function in the Arduino IDE. Because we use the UART communication between the Nextion display and the microcontroller, the baud rate is set to 9600 which is recommended by Nextion. Also the Nextion library is initialized in the setup function. The last part of the setup function is to register the push or pop event callback functions. The callback function asks: When do I have to executed the predefined functions? Therefore we attach the push event to both objects and define that if the event occurs, the predefined functions should be called.
If we did not defined touch press events but touch release events, the functions would be: b0.attachPop(b0PopCallback, &b0);

The loop function contains only one line of code. In this line of code we define that in every cycle we monitor the events of the touch event list. If an event happens, the callback function of the setup function is executed.

The following video shows how the number of the counter increases and can be reset with the reset button.

Advanced Nextion Example – Light and Temperature

This advanced example shows how to use the internal programming capabilities of the Nextion displays and also how to control lights and visualize the temperature and humidity of a DHT11 sensor module.

You can download all files used in this example (Nextion Editor TFT file, fonts, Arduino code) as zip file with the following download button

First we create the interface in the Nextion Editor. Therefore create a new project and select your display model. For this advanced example I use the landscape orientation of the display. You can use the already created font from the basic example or create a new one. The following two pictures show the interface we want to build with two pages.

Page 0

Page 1

example 2 page 2

On the first page we create two text boxes which remain static in the whole example. With the toolbox panel we change the text inside the text boxes to “Light” and “bt0.value”.

Under the light text we create a dual-state button and change the text to “OFF”. With this button we want to turn a light on and off. Depending on the status of the light, I want to change the text of the button. This could be done via the microcontroller with the functions getText and setText but we want to change the text direct with the programmable capabilities of the display. Therefore in the event code panel of the editor we create a simple if equation that takes advantage of the changing value of the dual-state button. If the dual-state button is not pressed, the value is 0 and the text of the button is set to “OFF”. But in all other cases, when the button is pressed and the value is 1, the text changes to “ON”.
The change in the value of the dual-state button should also be visualized in a number component. We create a new number component under the other text field. To display the value of the dual-state button, we simply set the value of the number component to the value of the dual-state button when the touch press event occurs.
Also we have to send the component ID to the microcontroller when the button is pressed to turn on the light.
The following picture shows the code in the event panel of the dual-state button.

example2 dual-statebutton code

The last component that we add to page 0 is a button to get to the next page. We create a new button and place it to the bottom right of the screen. You can change the color for the button like I did in the toolbox plane and change the text to “Next Page”. Of cause we have to add the function to change the page, when the button is pressed. This is done by the touch press event you see in the following picture. The command is page with the page ID of the target page.

example2 nextpage

I also want to send the component ID when the next page button is pressed, because I use this trigger to update the temperature and humidity on the second page.

On the second page we create two text fields and two number components. Each text field displays the sensor value that is shown in the number components. For fun I also changed the background color of the number components.
Because I want to go back to page 0 from page 1, I created a button to get back to page 0. The code is the same, but the ID of the page is 0.

Now every site and component is set up and you can test if everything is working with the debug function of the Nextion Editor. After everything is working you can compile the project and export the TFT file to the micro SD card.

The next task is to connect the display with your microcontroller and all other components. I use my Arduino Uno as microcontroller, the DHT11 sensor module to measure the temperature and humidity as well as the 7 color flash LED (KY-034) as light. The following fritzing picture shows how to connect all the devices.

Nextion example2 fritzing

Because we implement a whole bunch of the functionality of the interface directly in the Nextion Editor, the Arduino script is not very complicated.

#include "DHT.h"
#include "Nextion.h"

#define DHT11modulePIN 7        // define the digital I/O pin
#define DHT11moduleTYPE DHT11   // DHT 11 module
#define LEDPIN 6                // define the digital I/O pin

DHT dht11module(DHT11modulePIN, DHT11moduleTYPE);

// Declare Nextion objects
// The the following informations from Nextion Editor
// (page id, component id, component name)
NexDSButton bdslight = NexDSButton(0, 2, "bt0");
NexButton nextpage0 = NexButton(0, 1, "b0");
NexNumber ntemp = NexNumber(1, 4, "n0"); 
NexNumber nhum = NexNumber(1, 4, "n1"); 

// Register objects to the touch event list
NexTouch *nex_listen_list[] = {
  &bdslight,
  &nextpage0,
  NULL
};


void bdslightPushCallback(void *ptr) {
  uint32_t dual_state;
  bdslight.getValue(&dual_state);
  if(dual_state) 
  {
      digitalWrite (LEDPIN, HIGH); // set the LED on
  }
  else
  {
      digitalWrite (LEDPIN, LOW); // set the LED off
  }
}


void nextpage0PushCallback(void *ptr) {
  float h11module = dht11module.readHumidity();
  float t11module = dht11module.readTemperature();
  nhum.setValue(h11module);
  ntemp.setValue(t11module);
}


void setup() {
  Serial.begin(9600);
  pinMode (LEDPIN, OUTPUT);
  dht11module.begin();

  nexInit();
  // Register the push/pop event callback function
  bdslight.attachPush(bdslightPushCallback, &bdslight);
  nextpage0.attachPush(nextpage0PushCallback, &nextpage0);
}

void loop() {
  nexLoop(nex_listen_list);
}

At the beginning of the Arduino script we include the Nextion and DHT libraries and define the pins where the DHT11 module and the LED is connected. With the DHT11 model type and the pin, we create a dht11module object.

Like in the beginner example we create 4 Nextion objects:

  • One dual-state button to turn the LED on and off
  • One button from the page 0 to update the temperature and humidity
  • Two number objects to display the temperature and the humidity of the DHT11 sensor module

From all four objects only the dual-state button and the button to get to the next page trigger an event and are therefore added to the touch event list.

Now we define the functions for the touch event list. The first function for the dual-state button creates a variable to store the value of the dual-state button. If the value is 1, the light is turned on via the digitalWrite function and otherwise the value has to be 0 and the dual-state button turns off the LED.

The function for the next page button on page 0 reads the temperature and the humidity and set the corresponding values of the number objects to the measurements.

In the setup function the baud rate is set to 9600 and the pin of the LED is defined as output. Then the DHT11 object and the display is initialized. Like in the basic example the callbacks of the objects from the touch event list are registered as push callback.

The loop function contains only the line of code to define that in every cycle we monitor the events of the touch event list. If an event happens, the callback function of the setup function is executed.

The following video shows how the light in turned on and off. Also the temperature and the humidity is displayed in the second page of the interface.

I hope you learned a lot about the Nextion display in this tutorial. If you have any question regarding the Nextion displays in general or the examples in this article, use the following comment section to ask your question. I will answer the question as soon as possible.

Analog Multiplexer Thumbnail

Increase the Number of Analog Inputs with an Analog Multiplexer

Increase the Number of Analog Inputs with an Analog Multiplexer

One of the most used micrcontroller in my DIY projects is the ESP8266. But all ESP8266 boards like the ESP8266 NodeMCU or the WeMos D1 Mini have one mayor downside:

They have only 1 analog input pin.

But you can increase the number of analog inputs with an analog multiplexer. In this tutorial I show you how to increase the number of analog inputs to 4, 8 or 16 with an analog multiplexer.

Analog Multiplexer Thumbnail

Table of Contents

Function of a Multiplexer

In my opinion the best explanation of a multiplexer is a big switch which connects all inputs with one output. Which input is connected to the output is defined by the state of the select lines pins.
Because only one input is connected to the output, all other lines loose the connection. This is important because devices that require a continuous signal (like a servo motor) will not work in combination with a multiplexer.

Multiplexer Schema

A multiplexer of 2^n inputs has n select lines which is shown in the following table.


In this tutorial I use the CD74HC4051 analog multiplex from Texas Instruments

74HC4051 Data Sheet and Pins

Before we start with the practical example, let us quickly summarize the data sheet of the CD74HC4051.
The 74HC4051 is an 8 bit analog multiplexer / demultiplexer and therefore build up with bidirectional switches that allow any analog input to be used as an output and the way around.

The most important value is the maximum input voltage with is 5V for the analog multiplexer. The 5V fits well with all Arduino and the EPS8266 based microcontroller. You find the whole data sheet here.

CD74HC4051

The functionality of the CD74HC4051 as analog multiplexer is easy explained in two steps:

  1. The multiplexer gets the select line signal from the 3 digital outputs of the microcontroller.
  2.  If the enable state is set to LOW, the corresponding analog input (A0…A7) is connected with the analog output (A)

The following table shows the input states of the CD74HC4051 and the corresponding analog output channel.

If Enable (E) is HIGH the multiplexer is disabled independent of the select line signals.

Increase the Analog Inputs on the ESP8266

In the following example we increase the number of analog inputs of the ESP8266 NodeMCU and WeMos D1 Mini, which have only one analog input pin. The analog inputs I choose are:

  • 1 photoresistor
  • 1 potentiometer

But you can choose any other analog device.

The following pictures show the wiring between all components and the ESP8266 microcontroller.

The photoresistor is connected to the 74HC4051 via a voltage divider with a 10kΩ resistor on pin A1. The potentiometer is directly connected to the multiplexer on pin A0. All other analog pins are connected to ground. Moreover the pins VEE and E are also connected to ground. The address select pins are connected to the ESP8266 like the following: 

  • S0 -> D3
  • S1 -> D2
  • S2 -> D1

Now lets dive in to the program code.

const int selectPins[3] = {D3, D2, D1};
const int analogInput = A0;

void setup() 
{
  Serial.begin(9600);
  // Set up the select pins as outputs:
  for (int i=0; i < 3; i++)
  {
    pinMode(selectPins[i], OUTPUT);
    digitalWrite(selectPins[i], HIGH);
  }
  
  // Create header table
  Serial.println("Y0\tY1\tY2\tY3\tY4\tY5\tY6\tY7");
  Serial.println("---\t---\t---\t---\t---\t---\t---\t---");
}

void loop() 
{
  // Loop through all eight pins.
  for (byte pin=0; pin <= 7; pin++)
  {
      for (int i=0; i < 3; i++) {
          digitalWrite(selectPins[i], pin & (1 << i)?HIGH:LOW);
      }
      int inputValue = analogRead(analogInput);
      Serial.print(String(inputValue) + "\t");
  }
  Serial.println();
  delay(1000);
}

First we have to define the connected pins. As mentioned before we connected the 3 digital pins D3, D2, D1 as well as the analog input A0. For the digital pins we create an array to loop through the pins easily during later stages in the code.

In the setup function we first set the baud rate to 9600 which must match to the rate in the serial monitor. Then we loop through the selectPins array and set every digital pin as output
The last part of the setup function is more an optical preference. We create a virtual table in the serial monitor by setting a tabulator space between all possible 8 analog values.

In the loop function we loop over all 8 possible analog pins and set the select pins HIGH and LOW with a little bit confusing formula. But the following table shows all the different combinations to get the selected pins set correct.

We calculate the state of each select pin in 3 steps:

  1. 1<bit-shift of each 3 select pins
  2. pin & (1<<i): bitwise AND with the selected analog output which should be selected
  3. pin & (1<<i)?HIGH:LOW: calculate the ternary conditional which is in this case very easy. If pin & (1<<i) is 0, then set the condition to LOW and otherwise HIGH.

After we set the select pins, the analog multiplexer is configured to read the desired output. We read the analog value with the build in function analogRead and print the value to the serial monitor. Each value is separated with a tabulator like the header we created in the setup function.

Now the program is reading all analog input values. In the following picture you see a screenshot of the serial monitor

Analog Multiplexer Serial Output

The first value Y0 is the potentiometer. You see from the picture that I increase and decrease the resistance and therefore the analog value. The second value Y1 is the photoresistor which I influence by holding my hand on it to make it dark and change the analog value.

One thing that surprises me is that all other analog values Y2…Y7 are not always 0 although I connected all other analog input pins on the multiplexer with ground. My assumption is that there are some back coupling between the analog signals but I do not know how to remove the noise in the analog signals which are connected to ground. If you know why the other analog values are not zero, write your suggestion in the comment section below.

I also installed a decoupling capacitor between VCC and ground on the 74HC4051 because I saw this circuit for the sparkfun 74HC4051 multiplexer breakout board. But after the installation of the decoupling capacitor there was no change in the serial monitor.

In my opinion, either you know which analog signals from the multiplexer are connected and only read for example the first three or you can set a threshold > 10 to read all analog signals.

I hope you like this tutorial how you can increase the analog inputs on your ESP8266 NodeMCU or WeMos D1 Mini for your next project. If you have any questions you can use the comment section below and I will ask your questions as soon as possible.

If you are also interested how to increase the number of digital outputs with a shift register, then I can recommend this article.

Arduino RFID Sensor

RFID Sensor Tutorial for Arduino, ESP8266 and ESP32

RFID Sensor Tutorial for Arduino, ESP8266 and ESP32

In this tutorial you learn everything you have to know about RFID for your next project with an Arduino, ESP8266 or ESP32 microcontroller.

After we learn the basics of a RFID system, we see how power and data is transferred between the RFID reader and the tag.

After the theory an example of an automated coffee counter shows you the RC522 module in action.

Arduino RFID Sensor

Table of Contents

What is RFID?

RFID stands for Radio-frequency identification and is an electronic communication technique mostly used to identify objects. Moreover RFID summaries all identification system which use radio frequency.

Typical use cases are:

  • Identify books in a library
  • Open a barrier only for specific cars
  • Access employees to restricted areas using a RFID system to open doors.

The advantage compared to barcode is that there is no direct line of side required between RFID tag and reader.

Components in an RFID System

In a general RFID setup there is an RFID reader and a tag (transponder) that should be identified. The following picture shows the different components in detail.

Components in an RFID System

The reader consists of three parts. The radio frequency signal generator generates the electromagnetic field through a coil which is send out to power tags. There is also a receiver and signal detector to read the response of the tag The microcontroller is the head of the reader and controls the other components and further processes the information.

The tag has a transponder which receives the radio waves from the reader and also sends data back to the reader. The receiver circuit stores the energy in the tag to power the microcontroller. The microcontroller itself is connected with a memory where the information is stored which can be transmitted to the reader.

There are two fundamental different types of RFID systems:

  1. Passive system where tags do not have an internal source of power and therefore are powered from the RFID reader device by radio waves.
  2. Active system where tags are powered by a battery and can be read by a longer distance up to hundreds of meters.

The following table shows the differences of passive and active tags on different categories:

Source: OECD (2008-06-18), “RFID Guidance and Reports”, OECD Digital Economy Papers, No. 150, OECD Publishing, Paris. http://dx.doi.org/10.1787/230334062186

Power Transmission

From the table you see that in a passive RFID system the tag has no internal power supply and therefore has to be powered from the reader. The reader is sending out an electromagnetic field through an antenna coil. This electromagnetic field is received from the coil of the tag’s transponder and creates an induction voltage which serves as power supply for the microchip on the tag and is stored inside the receiver circuit.

In case of an active RFID system there is no need for a power transmission because the tag itself has an internal power supply.

Data Transmission

After the tag is powered by the induction voltage of the RFID reader, the tag sends data to the reader via load manipulation. Load is switched on and off on the tag. Because the reader and tag are inductive coupled, a change in the load at the tag results in a change of the power consumption of the readers antenna. This change in consumption is represented as voltage drop and interpreted as 1 and 0.

An other data transmission approach is data transmission via backscattered coupling. The tag creates a second electromagnetic field with the power though the first field. This second field is received by reader and through changes in the second electromagnetic field, data is transmitted.

Normally the first data that is transmitted from the tag to the reader are the UID and the PICC type which identifies the tag.

  • UID: The UID is the Unique Identifier of the tag for example: “BD 31 15 2B”. The UID is saved in the first memory block of the tag and read-only. Therefore the identifier can not be changed.
  • PICC: Short for Proximity Integrated Circuit Card. This is the type of tag, like that car is a Ford. For example a frequently used RFID tag for Arduino or ESP8266 microcontrollers is the MIFARE 1KB which I also use in this tutorial.

RFID Frequency Bands

In general there are different frequency bands where the RFID application can operate. The following table shows the different frequency bands.

Source: https://en.wikipedia.org/wiki/Radio-frequency_identification

RFID RC522 Module

In this tutorial I use the RC522 module as reader and also different tags which are compatible to that reader. Normally you can buy the reader with some tags as a package to make sure that the reader is able to identify the tag. It is important that the frequency is matching and that the reader supports the format of the tag.

The RC522 module is based on the Philips MF522-AN-on board and supports a RFID frequency of 13.56 MHz as well as the following tag formats: S50, S70 Ultralight, Pro, DESFire. The RC522 is connected to the Arduino or ESP8266 microcontroller via SPI which allows a transmission rate between reader and microcontroller up to 10 Mbit/s.

It is very important to supply the RC522 module only with 3.3V and not 5V.

If you use an Arduino Pro Mini, then only the 3.3V model.

The current consumption is very low between 80 µA and 26 mA:

  • Data transmission: 13…26 mA
  • Idle state: 10…13 mA
  • Sleep state: 80 µA

The tag is a Mifare transponder with 1 KB of memory which is divided into 16 sectors, each sector into 4 blocks and each block can store 2 bytes of data. Each sector has two keys (A/B) which can be assigned with rights for reading and writing memory blocks. The last block contains the keys and the rights (access conditions).

The following picture shows how the memory is build up:

RFID RC522 dumpinfo

The sectors are numbered from 0 to 15 and the block number for every block (containing 2 bytes) is serially numbered from 0 to 63.
The output from the picture is called DumpInfo and is an example that comes with the installation of the MFRC522 library. The following pictures shows how you find this example: File → Examples → MFRC522 → DumpInfo

Arduino IDE DumpInfo

The Mifare classic has a proprietary “Crypto-1” algorithm which is not secure anymore since 2008. There are newer MIFARE DESFire EV1 and EV2 tags which are secure until today. But for some DIY projects the security is in my case not so important.

RFID reading and writing examples

The following table gives you an overview of all components and parts that I used for this tutorial. I get commissions for purchases made through links in this table.

Now we dive into the practical part of this tutorial. I prepared two examples.

  1. In the first example we only want to read the Unique Identifier of the tag and if this tag is valid we want to display the validation in the serial output. This example is the foundation of a secure access system.
  2. The second example is a little bit more complicated because we want not only read data from the tag’s memory, we also want to write data to the memory. In this example we want to create a coffee list, where we save a counter on the tag and every time the tag is recognized by the reader the counter is increased.

The following two pictures show the detailed connection between the devices. The connection between the microcontroller and the RC522 module will be the same in both examples.

Because the RFID reader uses SPI communication, you have to know the SPI pins on your microcontroller. If you are not sure what are the SPI pins on your micorcontroller, you find a detailed overview in the pinout blog post of the following microcontroller:

RFID RC522 Arduino Nano

RFID RC522 Arduino Nano

RFID RC522 Arduino Pro Mini 3.3V

RFID RC522 Arduino Pro Mini 3.3V

RFID RC522 Arduino Uno

RFID RC522 Arduino Uno

RFID RC522 ESP32 NodeMCU

RFID RC522 ESP32 NodeMCU

RFID RC522 ESP8266 NodeMCU

RFID RC522 ESP8266 NodeMCU

RFID RC522 ESP32 WeMos D1 Mini

RFID RC522 ESP32 WeMos D1 Mini

At the end of this article you find a download button to download the whole program code as zip file from the two examples.

Validation of tag due to Unique Identifier

In the first example we want to read the identifier of the tag and when the identifier is valid we want to print this in the serial monitor. The valid tag is therefore defined in the program code.

#include "SPI.h"
#include "MFRC522.h"

// For Arduino Microcontroller
#define RST_PIN         9
#define SS_PIN          10

// For ESP8266 Microcontroller
//#define RST_PIN         D0
//#define SS_PIN          D8

// For ESP32 Microcontroller
//#define RST_PIN         27
//#define SS_PIN          15


MFRC522 mfrc522(SS_PIN, RST_PIN);   // Create MFRC522 instance.
MFRC522::MIFARE_Key key;

At the beginning of the script we have to include the SPI library to activate the SPI communication between the microcontroller and the RC522 module. The second library is the MFRC522 which makes it easier to handle the RFID module. You can find detailed information about the MFRC522 library by miguelbalboa in his github repository.

If you do not know how to install a library in your Arduino IDE, then you find here a step by step tutorial.

After we include the libraries we define the pin of the reset and the SPI slave select. You can see from my fritzing sketches that I choose pin 9 and 10 for the Arduino microcontroller. If you are using an ESP8266 or ESP32 microcontroller, you can uncomment the lines of code of the microcontroller and comment the two lines of code for the Arduino.

Also we create a MFRC522 instance and a key.

void dump_byte_array(byte *buffer, byte bufferSize) {
    for (byte i = 0; i < bufferSize; i++) {
        Serial.print(buffer[i] < 0x10 ? " 0" : " ");
        Serial.print(buffer[i], HEX);
    }
}

void get_UID(String content) {
  for (byte i = 0; i < mfrc522.uid.size; i++) 
  {
     content.concat(String(mfrc522.uid.uidByte[i] < 0x10 ? " 0" : " "));
     content.concat(String(mfrc522.uid.uidByte[i], HEX));
  }
  content.toUpperCase();
  if (content.substring(1) == "E3 26 92 03")
  {
    Serial.println("This is the right tag");
  }
 else   {
    Serial.println("Wrong tag");
  }
}

In the setup function we first set the baud rate to 9600 which has to match to the baud rate on your serial monitor. We wait until the serial line communication is ready and initialize the SPI bus and the MFRC522 instance we created before.

Now we set the key A and B to FFFFFFFFFFFFh which is the fault key value. Because we can only upload arrays as HEX we have to use a self created function called dump_byte_array that gets a byte array and the length of the array and transfer it to HEX.

void loop() {
    // Reset the loop if no new card present on the sensor/reader. This saves the entire process when idle.
    if ( ! mfrc522.PICC_IsNewCardPresent())
        return;

    // Select one of the cards
    if ( ! mfrc522.PICC_ReadCardSerial())
        return;

    // Show some details of the PICC (that is: the tag/card)
    Serial.print(F("Card UID:"));
    dump_byte_array(mfrc522.uid.uidByte, mfrc522.uid.size);
    Serial.println();
    Serial.print(F("PICC type: "));
    MFRC522::PICC_Type piccType = mfrc522.PICC_GetType(mfrc522.uid.sak);
    Serial.println(mfrc522.PICC_GetTypeName(piccType));
   

    // Check for compatibility
    if (    piccType != MFRC522::PICC_TYPE_MIFARE_MINI
        &&  piccType != MFRC522::PICC_TYPE_MIFARE_1K
        &&  piccType != MFRC522::PICC_TYPE_MIFARE_4K) {
        Serial.println(F("No valid tag"));
        return;
    }
    
    MFRC522::StatusCode status;
   
    String content= "";
    get_UID(content);
    
    // Halt PICC
    mfrc522.PICC_HaltA();
    // Stop encryption on PCD
    mfrc522.PCD_StopCrypto1();
}

The loop function starts with checking if an RFID tag is available. If not we restart to loop function. If a tag is recognized, the tag is selected.

Next we want to display the UID and the PICC type of the tag in the serial monitor. Therefore we also use the function dump_byte_array and the function of the MFRC522 library mfrc522.uid.uidByte. To get the PICC type we use an other function of the library called mfrc522.PICC_GetType.

After we know the UID and the PICC type we have to check for compatibility. The PICC type has to be one of the following types:

  • MIFARE MINI
  • MIFARE 1K
  • MIFARE 4K

Because the tag I use is a MIFARE 1K it is valid at this point.

Now we want to check if the card that we are currently reading is the one with the identifier that we defined as valid. First we want to make sure that the card is still available and fetch the current status with the function MFRC522::StatusCode status.

To check if it is the right card we use a second self written function called get_UID which has a string as argument. The function reads the UID again but does not display the ID to the serial monitor but checks if the ID is “E3 26 92 03”. If it is the same ID then we print the result to the serial monitor and if it is the wrong ID we print that it is the wrong tag.

At the end of the loop function we halt the PICC and stop the encryption of the PCD.

void dump_byte_array(byte *buffer, byte bufferSize) {
    for (byte i = 0; i < bufferSize; i++) {
        Serial.print(buffer[i] < 0x10 ? " 0" : " ");
        Serial.print(buffer[i], HEX);
    }
}

void get_UID(String content) {
  for (byte i = 0; i < mfrc522.uid.size; i++) 
  {
     content.concat(String(mfrc522.uid.uidByte[i] < 0x10 ? " 0" : " "));
     content.concat(String(mfrc522.uid.uidByte[i], HEX));
  }
  content.toUpperCase();
  if (content.substring(1) == "E3 26 92 03")
  {
    Serial.println("This is the right tag");
  }
 
 else   {
    Serial.println("Wrong tag");
  }
}

The following picture shows that I tried to get access two times with a tag that ID is “39 3F 50 A2” and that the program code is running correct, telling me that it is the wrong ID. The third attempt was the valid tag and I got access.

RFID validation UID

Automated Coffee Counter

In this second example we want not only read out a specific memory block of the tag, we also want to write into this block. In this example we create a coffee list where each time an employee gets a coffee her or his tag is scanned by the reader. The reader increases the bit we choose to count the coffees and write the increased counter back to the tag.

Also we want to have a master tag which enables the option to reset the coffee counter to 0. If someone pays the bill, the master tag is identified by the reader and the counter of the next tag will be reset.

A lot of the program code is the same compared to the first example. Therefore I only describe the changes and additional code lines.

#include "SPI.h"
#include "MFRC522.h"

// For Arduino Microcontroller
#define RST_PIN         9
#define SS_PIN          10

// For ESP8266 Microcontroller
//#define RST_PIN         D0
//#define SS_PIN          D8

// For ESP32 Microcontroller
//#define RST_PIN         27
//#define SS_PIN          15


MFRC522 mfrc522(SS_PIN, RST_PIN);   // Create MFRC522 instance.
MFRC522::MIFARE_Key key;

byte sector         = 1;  //  Number of sector to write
byte blockAddr      = 4;  // Number of block to write
byte dataBlock[]    = {
    0x00, 0x00, 0x00, 0x00,
    0x00, 0x00, 0x00, 0x00,
    0x00, 0x00, 0x00, 0x00,
    0x00, 0x00, 0x00, 0x00};

byte reset_counter = 0;

byte trailerBlock = 7;  // Block address
byte buffer[18];

In the first section we have to add some more variables:

  • byte sector: we want to write our coffee counter in the first sector.
  • byte blockAddr: in the first sector we choose the fourth block for the counter.
  • byte dataBlock: is the array which is written to the fourth block in the first sector and defined as HEX.
  • byte reset_counter: is a flag we set when the master tag was read. This flag indicates to reset the counter or not.
  • byte trailerBlock: defines the block where the key A and key B is stored.
  • byte buffer: is the array that is filled when we read out the block 4 of the tag’s memory.
void setup() {
    Serial.begin(9600); // Initialize serial communications with the PC
    while (!Serial);    // Do nothing if no serial port is opened (added for Arduinos based on ATMEGA32U4)
    SPI.begin();        // Init SPI bus
    mfrc522.PCD_Init(); // Init MFRC522 card

    // Prepare the key (used both as key A and as key B)
    // using FFFFFFFFFFFFh which is the default at chip delivery from the factory
    for (byte i = 0; i < 6; i++) {
        key.keyByte[i] = 0xFF;
    }
    dump_byte_array(key.keyByte, MFRC522::MF_KEY_SIZE);
    Serial.println();
}

The setup function is 1:1 the same from the previous example.

void loop() {
    // Reset the loop if no new card present on the sensor/reader. This saves the entire process when idle.
    if ( ! mfrc522.PICC_IsNewCardPresent())
        return;

    // Select one of the cards
    if ( ! mfrc522.PICC_ReadCardSerial())
        return;


    byte size = sizeof(buffer);

    // Show some details of the PICC (that is: the tag/card)
    Serial.print(F("Card UID:"));
    dump_byte_array(mfrc522.uid.uidByte, mfrc522.uid.size);
    Serial.println();
    Serial.print(F("PICC type: "));
    MFRC522::PICC_Type piccType = mfrc522.PICC_GetType(mfrc522.uid.sak);
    Serial.println(mfrc522.PICC_GetTypeName(piccType));
   

    // Check for compatibility
    if (    piccType != MFRC522::PICC_TYPE_MIFARE_MINI
        &&  piccType != MFRC522::PICC_TYPE_MIFARE_1K
        &&  piccType != MFRC522::PICC_TYPE_MIFARE_4K) {
        Serial.println(F("This sample only works with MIFARE Classic cards."));
        return;
    }
    
    MFRC522::StatusCode status;

    authenticate_key_A();
    
    read_sector(size);
    
    compute_coffee_counter();
    
    authenticate_key_B();

    write_block();

    check_block();

    
    String content= "";
    reset_counter_function(content);
    

    // Halt PICC
    mfrc522.PICC_HaltA();
    // Stop encryption on PCD
    mfrc522.PCD_StopCrypto1();
}

The loop function starts and ends the same compared to the first example. Only the length of the buffer array is recalculated each time because this length could change when writing to the tag. In the middle part we execute a couple more functions which I describe in the next section of this tutorial:

  • authenticate_key_A(): before we can read the values of block 4 we have to authenticate with key A.
  • read_sector(): after the authentication we read the block 4.
  • compute_coffee_counter(): either we increase the coffee counter in block 4 or reset the counter.
  • authenticate_key_B(): then we need another authentication with key B before we can write the changed values to block 4.
  • write_block(): write the new content to block 4.
  • check_block(): Check if the block was written correctly or if the transmission was interrupted.
void dump_byte_array(byte *buffer, byte bufferSize) {
    for (byte i = 0; i < bufferSize; i++) {
        Serial.print(buffer[i] < 0x10 ? " 0" : " ");
        Serial.print(buffer[i], HEX);
    }
}

The function dump_byte_array is the same as in the first example.

void reset_counter_function(String content) {
  for (byte i = 0; i < mfrc522.uid.size; i++) 
  {
     content.concat(String(mfrc522.uid.uidByte[i] < 0x10 ? " 0" : " "));
     content.concat(String(mfrc522.uid.uidByte[i], HEX));
  }
  content.toUpperCase();
  if (content.substring(1) == "E3 26 92 03")
  {
    reset_counter = 1;
  }
 
 else   {
    reset_counter = 0;
  }
}

The function to reset the counter is nearly the same as in the first example to decide if the UID is valid or not. But in this example we change the reset_counter variable to 1 if we want to reset the counter for the next tag or if we leave the variable to 0, indicating that the counter has to be incremented by 1.

void compute_coffee_counter() {
  // Read current coffee counter and increase the counter or reset to 0
  int coffee_counter = buffer[0];
  Serial.print("Your old coffee counter is: ");
  Serial.println(coffee_counter);
  
  Serial.print("Status reset: ");
  Serial.println(reset_counter);

  if (reset_counter == 1) {
    dataBlock[0] = 0;
    reset_counter = 0;
  }
  else {
    dataBlock[0] = coffee_counter+1;
  }

  Serial.print("Your new coffee counter is: ");
  Serial.println(dataBlock[0]);
}

Now we want to change the counter. Therefore we read the first element of the buffer array and save this value to the variable coffee_counter as integer. We print the old value of the counter to the serial monitor and evaluate the variable reset_counter as mentioned before. If reset_counter is 1, the previous read tag was the master tag and we set the counter to 0 and also reset the variable reset_counter. If there was no master tag we increase the counter by 1.

void authenticate_key_A() {
  // Authenticate using key A
  Serial.println(F("Authenticating using key A..."));
  MFRC522::StatusCode status = (MFRC522::StatusCode) mfrc522.PCD_Authenticate(MFRC522::PICC_CMD_MF_AUTH_KEY_A, trailerBlock, &key, &(mfrc522.uid));
  if (status != MFRC522::STATUS_OK) {
      Serial.print(F("PCD_Authenticate() failed: "));
      Serial.println(mfrc522.GetStatusCodeName(status));
      return;
  }
}

void authenticate_key_B() {
  // Authenticate using key B
  Serial.println(F("Authenticating again using key B..."));
  MFRC522::StatusCode status = (MFRC522::StatusCode) mfrc522.PCD_Authenticate(MFRC522::PICC_CMD_MF_AUTH_KEY_B, trailerBlock, &key, &(mfrc522.uid));
  if (status != MFRC522::STATUS_OK) {
      Serial.print(F("PCD_Authenticate() failed: "));
      Serial.println(mfrc522.GetStatusCodeName(status));
      return;
  }
}

The two function for the authentication use the function mfrc522.PCD_Authenticate from the library. After the authentication we can read or write to different block of the memory.

void read_sector(byte size) {
  // Show the whole sector as it currently is
  Serial.println(F("Current data in sector:"));
  mfrc522.PICC_DumpMifareClassicSectorToSerial(&(mfrc522.uid), &key, sector);
  Serial.println();

  // Read data from the block
  Serial.print(F("Reading data from block ")); Serial.print(blockAddr);
  Serial.println(F(" ..."));
  MFRC522::StatusCode status = (MFRC522::StatusCode) mfrc522.MIFARE_Read(blockAddr, buffer, &size);
  if (status != MFRC522::STATUS_OK) {
      Serial.print(F("MIFARE_Read() failed: "));
      Serial.println(mfrc522.GetStatusCodeName(status));
  }
  Serial.print(F("Data in block ")); Serial.print(blockAddr); Serial.println(F(":"));
  dump_byte_array(buffer, 16);
  Serial.println();
}

The next function reads the data from the memory sector and uses the library function mfrc522.MIFARE_Read with the address of the block, the array to save the block data and the size of the array as argument.

void write_block(){
  // Write data to the block
  Serial.print(F("Writing data into block ")); Serial.print(blockAddr);
  Serial.println(F(" ..."));
  dump_byte_array(dataBlock, 16);
  Serial.println();
  MFRC522::StatusCode status = (MFRC522::StatusCode) mfrc522.MIFARE_Write(blockAddr, dataBlock, 16);
  if (status != MFRC522::STATUS_OK) {
      Serial.print(F("MIFARE_Write() failed: "));
      Serial.println(mfrc522.GetStatusCodeName(status));
  }
  Serial.println();
}

The block to write to the memory is not too much different from the reading function but the library function mfrc522.MIFARE_Write instead of read is used.

void check_block(){
  // Check that data in block is what we have written
  // by counting the number of bytes that are equal
  Serial.println(F("Checking result..."));
  byte count = 0;
  for (byte i = 0; i < 16; i++) {
      // Compare buffer (= what we've read) with dataBlock (= what we've written)
      if (buffer[i] == dataBlock[i])
          count++;
  }
  Serial.print(F("Number of bytes that match = ")); Serial.println(count);
  if (count == 16) {
      Serial.println(F("Success :-)"));
  } else {
      Serial.println(F("Failure, no match :-("));
      Serial.println(F("  perhaps the write didn't work properly..."));
  }
  Serial.println();

  // Dump the sector data
  Serial.println(F("Current data in sector:"));
  mfrc522.PICC_DumpMifareClassicSectorToSerial(&(mfrc522.uid), &key, sector);
  Serial.println();
}

The last function check_block() compares the buffer element by element and also the size of the buffer. If the data was not written correctly the data is dumped and you have to start the writing of the coffee list again.

The following picture of the serial monitor shows how I increase the coffee counter and also that I reset the counter from 4 to zero. It is also possible not to reset the counter but to decrease the counter by 1 if the master tag was previously detected by the reader.

RFID Coffee Counter

I hope you like this tutorial and if you have any questions, please use the comment section below to ask you questions. I answer them as comment as soon as possible.

Arduino PISO and SIPO shift register

Shift Register Tutorial for Arduino, ESP8266 and ESP32

Shift Register Tutorial for Arduino, ESP8266 and ESP32

Do you know how to increase the number of digital pins for your microcontroller?

With a shift register it is easy to add more digital inputs and outputs to your Arduino, ESP8266 and ESP32 micrcocontroller.

Learn in this article:

  • Different configurations of shift register
  • What is the right application for each configuration
  • In total 3 examples witch different configurations of shift registers and their combination to read the state of multiple buttons to control different LEDs.
Shift Register Thumbnail

Table of Contents

What is a shift register?

Before I can explain the function of a shift register, you have to know what a flip-flop is, because a shift register is a cascade of multiple flip-flops sharing the same clock signal.

A flip-flop also called latch is a circuit with 2 stable states. These states are often used to store a single bit of information in binary format: 0 or 1.

There are different kinds of flip-flops which is not part of this tutorial. Regarding shift-register we are only interested in the D flip-flop. The D flip-flop has an input line called D, a clock line and an output line Q. The following table shows the truth table of a D flip-flop.

From the truth table you see that with a rising edge of the clock signal, the output changes to the data line. But if the clock signal is not rising, the output Q_next does not change.

Now basically a shift register is nothing else than multiple D flip-flops connected in a row where the output of each flip flop is connected to the input of the next flip flop. Because there is only one clock signal for all flip flops, a bit is shifted at each clock cycle in the bit array which the bit is stored in.

The following table shows this shifting of a bit if there are three D flip-flops and three clock cycles. At the beginning the bit 1 is in D1 and in each clock cycle this bit is shifted to the next flip-flow until at clock cycle 2 this bit reaches D3.

Now we know the basics of the shift register and because shift registers can have parallel and serial inputs and outputs different configurations are possible. Most used configurations are:

  • Serial in, serial out (SISO)
  • Serial in, parallel out (SIPO)
  • Parallel in, serial out (PISO)

From the configurations you can see that shift registers are most used to convert signals between serial and parallel interfaces. In the following sub chapters we take a closer look at each of the configurations.

Serial-In, Serial Out (SISO)

Serial-In Serial-Out (SISO)

The following table shows the truth table of the SISO shift-register with four flip-flops.

The SISO shift register configuration is the simplest kind because the input and output are both only one serial line. You might think: What is the use of such a shift register?

If you look at the logic circuit, you see that the SISO consists of n flip flops in a row where is output of the current flip-flop is the input of the next flip-flop. Therefore the input bit is available at the output in n clock cycles. SISO are used to create a time delay in a signal. The most used 8 bit SISO shift register is the 74HC595.

Serial-In, Parallel-Out (SIPO)

Serial-In Parallel-Out (SIPO)

The following table shows the truth table of the SIPO shift-register.

The serial-input, parallel-output shift register is based on the SISO but after each flip flop there is an output line. This makes the output parallel. The main use of a SIPO shift register is to convert serial data into parallel data, also called demultiplexing. This is very useful when you want to output some data from your microcontroller but there are not enough pins available.

Later in the example we connected the output pin of an Arduino Uno to the serial input of the shift register. The parallel output of the shift register is then connected to multiple LEDs.

The only downside using a SIPO instead of multiple pins on your Arduino or ESP8266 microcontroller is that the connection is slower than the parallel output.

The most used 8-bit SIPO shift registers are 74LS164 and 74LS594.

Parallel-In Serial-Out (PISO)

Parallel-In Serial-Out (PISO)

The following table shows the truth table of the PISO shift-register.

The parallel-in, serial-out has the opposite function then the serial-in, parallel-out shift register. The input is the most significant bit in the array of bits.

If the write/shift line is LOW you can write data into the shift register. The data is shifted from one flip-flop to the next one when the write/shift line is HIGH and at the same time the flip-flops are clocked. In each clock cycle the next bit is shifted to the output and if you have n flip-flops, then the output reads the last bit in n clock cycles.

In the example later in this tutorial we use the PISO to read multiple states of buttons and send this information multiplexed to one digital pin of our microcontroller. The parallel-in, serial-out shift register therefore has the objective to connect multiple inputs if the microprocessor has less I/O pins then needed.

The PISO has the same downside like the SIPO, that the connection is slower than the parallel input.

The most used 8-bit PISO shift register is the 74HC166.

Universal Shift Registers

There are also universal shift registers with a bidirectional usage. That mean, that these registers are able to work in all possible configurations: SISO, SIPO, PISO, PIPO. Unlikely there are no 8-bit universal registers available only 4-bit. If you wan to buy these kind of shift registers you can look aver TTL 74LS194, 74LS195 or CMOS 4035.

Shift register examples with multiple buttons and LEDs

In the following part of the whole tutorial I want to show you how to use two different shift registers to control multiple LEDs via the state of push buttons. In the first two examples we build up the sketch and program for each shift register individually and in the last example we combine the two examples:

  1. Create the circuit to control the LEDs with a SIPO shift register 74hc595n. You can obviously use any other SIPO for this example.
  2. Read the states of multiple push buttons with the 74HC166 PISO shift register.
  3. Put everything together and control the LEDs with the current states of the push buttons.

Control LEDs with SIPO 74hc595n

The 74hc595n is a Serial to Serial/Parallel 8-bit shift register has an operating voltage between 2V-6V and is therefore best suited for the Arduino or ESP8266 microcontroller. You find the whole data sheet here.

74hc595n

The functionality of the 74hc595n SIPO is easy explained in three steps:

  1. The latch (STCP pin) is pulled LOW, because the data is only stored in the register on a LOW → HIGH transition.
  2. Data is shifted out to the register with the data pin (DS) and with a LOW → HIGH transition of the clock signal (SHCP).
  3. The latch (STCP pin) is released HIGH to save the data in the register.

The following pictures show the wiring between the most used Arduino, ESP8266 and ESP32 microcontroller and the 74hc595n as well as the LEDs and resistors.

You can click on each picture to enlarge it. If you are missing your microcontroller, please write me a message in the comment section and I will add your microcontroller to the wiring.

Shift Register SIPO Arduino Nano

Shift Register SIPO Arduino Nano

Shift Register SIPO Arduino Pro Mini

Shift Register SIPO Arduino Pro Mini

Shift Register SIPO Arduino Uno

Shift Register SIPO Arduino Uno

Shift Register SIPO Arduino Mega

Shift Register SIPO Arduino Mega

Shift Register SIPO EPS32 NodeMCU

Shift Register SIPO EPS32 NodeMCU

Shift Register SIPO ESP8266 NodeMCU

Shift Register SIPO ESP8266 NodeMCU

Shift Register SIPO ESP8266 WeMos D1 Mini

Shift Register SIPO ESP8266 WeMos D1 Mini

The program code is maybe simpler than you think because there is a build in function for the Arduino IDE which shifts data automatically to the shift register. Let us take a look at the code and I explain the lines to you.

// for Arduino Microcontrollers
int latchPin_SIPO = 5;
int clockPin_SIPO = 7;
int dataPin_SIPO = 6;

// for ESP8266 Microcontrollers
//int latchPin_SIPO = D2;
//int clockPin_SIPO = D0;
//int dataPin_SIPO = D1;

// for ESP32 Microcontrollers
//int latchPin_SIPO = 21;
//int clockPin_SIPO = 23;
//int dataPin_SIPO = 22;
 
byte leds = 0;
 
void setup() 
{
  pinMode(latchPin, OUTPUT);
  pinMode(dataPin, OUTPUT);  
  pinMode(clockPin, OUTPUT);

  Serial.begin(9600);
}
 
void loop() 
{
  leds = 0;
  updateShiftRegister();
  delay(1000);
  for (int i = 0; i < 8; i++)
  {
    bitSet(leds, i);
    updateShiftRegister();

    for (int i = 7; i >= 0; i--)
    {
        bool b = bitRead(leds, i);
        Serial.print(b);
    }
    
    delay(1000);
    Serial.println(" ");
  }
}
 
void updateShiftRegister()
{
   digitalWrite(latchPin, LOW);
   shiftOut(dataPin, clockPin, LSBFIRST, leds);
   digitalWrite(latchPin, HIGH);
}

First we define the pins for the connection to the 74hc595n. The defined pins depend on the microcontroller. Therefore I added the program code not only for the Arduino pins but also for the ESP8266 and ESP32, but I comment the program lines. You simply have to uncomment the lines for the microcontroller, you have and comment the definition for the other microcontroller.

For all Arduino boards, pin D5 is connected to the storage register clock input (STCP), pin D7 to the shift register clock input (SHCP) and D6 is connected to the serial data input (DS).

If you use an ESP8266 board I use the digital pins D0, D1 and D2 for the storage register and shift register clock input as well was the serial data input.

For the ESP32 NodeMCU I use pin 21, 22 and 23 but you can use different digital pins if you like.

Also we define the variable leds as byte type to later store the information what bit we set to 1 to activate the corresponding LED.

In the setup function we have to declare the pins to the shift-register as outputs and also set the baud rate to 9600.

In the loop function we set the leds variable to zero because we want to initialize the 8-bit array with zeros. Therefore no LED will light up after updating the shift register with the function updateShiftRegister() which I describe in the next section of the code explanation.

After a delay of one second we enter a loop from 0 to 7 and in each iteration we set the next bit in the 8-bit array to 1. After each iteration we update the shift register again with the same function.

To visualize the array I use another for loop to print every bit in a line. Scroll down to the video to see the screenshot of the serial monitor.

The function updateShiftRegister() takes care that the shift register is updated after each iteration and at the beginning of the for loop. The function executes the same 3 step logic we defined earlier in this article:

  1. The latch (STCP pin) is pulled LOW, because the data is only stored in the register on a LOW → HIGH transition.
  2. Data is shifted out to the register with the data pin (DS) and with a LOW → HIGH transition of the clock signal (SHCP). We use the shiftOut function with the last significant bit first.
  3. The latch (STCP pin) is released HIGH to save the data in the register.

In this example code I use the option of LSBFIRST. Therefore you see in the following video, that the LEDs light up at the end of the for loop as bit 4 to bit 7, starting by the LED connected to Q3.

If I would change the option to MSBFIRST, the LEDs will light up at the beginning starting by the LED connected to Q0. You find the video under the next table.

The following picture shows the serial monitor as output of the SIPO example.

Shift Register SIPO Serial Output

Read the states of multiple buttons with the 74HC166 PISO

The 74HC166 is an 8-bit serial or parallel-in / serial-out shift register. For the power supply, the minimal voltage is 2V, the maximum voltage is 6V with a typical voltage of 5V. Therefore the 74HC166 can be used with an Arduino as well as with a ESP8266 microcontroller.

If you are interested in the whole datasheet, you find it on this website.

The right picture shows the pins of the 74HC166 which I describe in the following section.

74HC166

The following three steps describe the functionality of the 74HC166 shift register:

  1. First we set the latch (PE pin on D3) and the clock (CP pin on D4) LOW.
  2. On the LOW to HIGH transition of the clock pin data from D0…D7 is loaded into the shift register.
  3. Then PE is set HIGH to activate the serial mode of the register to transmit the collected data via the data line to the microcontroller with every LOW to HIGH transition of CP.

After we know how the 74HC166 is working, the next step is the wiring of the circuit to read the states of the buttons via the 74HC166 shift register.

At this point you have to make a decision which will influence the programming code because you can make a pull-down or a pull-up circuit with the buttons.

  • Pull-down configuration: If the button is not pressed the digital signal is LOW = 0
  • Pull-up configuration: If the button is not pressed the digital signal is HIGH = 1

The following two pictures show how I am creating a board for the pull-up configuration to save some wires 🙂

PISO pull-up board
PISO pull-up board

If you are not sure if you know the differences in a pull-down or pull-up configuration, I recommend to read this article where I explain the differences and function in detail.

I prepared both configurations for this tutorial to provide you the best possible knowledge. The following pictures shows the fritzing sketch of the PISO shift register in the pull-down and pull-up configuration. Either for both configurations we use 10kΩ resistors.

Shift Register PISO Pull-Down Configuration

To detect the pushed button you have to set all other values of the 8-bit shift register to 0 if you choose the pull-down configuration because the pushed button will pull the digital line HIGH = 1.

Shift Register PISO Pull Down Arduino Nano

Shift Register PISO Pull Down Arduino Nano

Shift Register PISO Pull Down Arduino Pro Mini

Shift Register PISO Pull Down Arduino Pro Mini

Arduino Shift Register PISO Pull-Down Arduino Uno

Arduino Shift Register PISO Pull-Down Arduino Uno

Shift Register PISO Pull Down Arduino Mega

Shift Register PISO Pull Down Arduino Mega

Shift Register PISO Pull Down EPS32 NodeMCU

Shift Register PISO Pull Down EPS32 NodeMCU

Shift Register PISO Pull Down EPS8266 NodeMCU

Shift Register PISO Pull Down EPS8266 WeMos D1 Mini

Shift Register PISO Pull Down EPS8266 WeMos D1 Mini

Shift Register PISO Pull-Up Configuration

But if you choose the pull-up configuration you can set all other pins to 1 to detect the pushed button, which sends a 0, when pushed. In my case I do not set all other pins to 1 because I know exactly which bit is changing from 1 to 0 if I press a button. You only have to connect the pins not to ground but to the 5V rail.

Shift Register PISO Pull Up Arduino Nano

Shift Register PISO Pull Up Arduino Nano

Shift Register PISO Pull Up Arduino Pro Mini

Shift Register PISO Pull Up Arduino Pro Mini

Arduino Shift Register PISO Pull-Up Arduino Uno

Arduino Shift Register PISO Pull-Up Arduino Uno

Shift Register PISO Pull Up Arduino Mega

Shift Register PISO Pull Up Arduino Mega

Shift Register PISO Pull Up EPS32 NodeMCU

Shift Register PISO Pull Up EPS32 NodeMCU

Shift Register PISO Pull Up EPS8266 NodeMCU

Shift Register PISO Pull Up EPS8266 NodeMCU

Shift Register PISO Pull Up EPS8266 WeMos D1 Mini

Shift Register PISO Pull Up EPS8266 WeMos D1 Mini

After everything is set up and all components are connected we can go over to the program script. The objective of this example is to display the state of four buttons in the serial monitor.

// for Arduino Microcontrollers
int latchPin_PISO = 3;
int clockPin_PISO = 4;
int dataPin_PISO = 2;

// for ESP8266 Microcontrollers
//int latchPin_PISO = D6;
//int clockPin_PISO = D5;
//int dataPin_PISO = D7;

// for ESP32 Microcontrollers
//int latchPin_PISO = 18;
//int clockPin_PISO = 19;
//int dataPin_PISO = 5;

int j;
int value;
byte switchVar = 0; // for pull down configuration
//byte switchVar = 1; // for pull up configuration

void setup() {
  pinMode(latchPin, OUTPUT);
  pinMode(dataPin, INPUT);  
  pinMode(clockPin, OUTPUT);

  Serial.begin(9600);
}

void loop() {
  byte dataIn = 0;
  digitalWrite(latchPin, 0);
  digitalWrite(clockPin, 0);
  digitalWrite(clockPin, 1);

  digitalWrite(latchPin, 1);
  
  for(j = 0; j < 8; j++) {
    value = digitalRead(dataPin);
    Serial.print("Position of Bit in 8-bit array: ");
    Serial.println(j);
    Serial.print("Value of Bit in 8-bit array: ");
    Serial.println(value);
    if (value) {
      int a = (1 << j);
      dataIn = dataIn | a;
      }
      digitalWrite(clockPin, LOW);
      digitalWrite(clockPin, HIGH);
    }

    if (switchVar != dataIn)
    {
      switchVar = dataIn;
      Serial.print("dataIn DEC: ");
      Serial.print(dataIn, DEC);
      Serial.println();
      Serial.print("dataIn BIN: ");
      Serial.print(dataIn, BIN);
      Serial.println();
    }
  delay(5000);
} 

Like in the first example of this tutorial, the first part is to define the pins which connect the microcontroller with the PISO shift register. The latch pin is connected to digital pin 3, the clock to pin 4 and the data line is connected to the digital pin 2.

Also we need three more variables:

  • j: used in a for loop to declare which bit is set to 1
  • value: stores the digital read value of the data pin
    • = 0 if no button is pressed
    • = 1 if a button is pressed
  • switchVar: stores a byte array to show which button was pressed depending on the pull-down or pull-up configuration

In the setup function, the latch and clock pin are defined as outputs and the data pin as input. Also the baud rate is set to 9600.

In the loop function we start the functionality of the 74HC166 shift register as described before in this article by pulling the clock and latch LOW. Then the clock is pulled HIGH to load the data into the shift register. By also pulling the latch HIGH the previously loaded data is sent to the microcontroller via the serial data line.

Now we want to find out which button was pressed. Therefore we scan all 8 possible bits in a for loop and read the digital data pin. In the following picture you see the scanning of all 8 bits and you also see that the last two bits are 1 because I pressed two buttons at the same time. Also note that I used the pull-down configuration of the buttons for this picture because only the bits are 1 for which the buttons is pressed and all other bits are 0.

PISO Shifting PullDown

If the value for this bit is 1, there is a bit-shift (<<) of a single bit for the value j. This bit-shifted value is the input of a bitwise OR operation with the variable dataIn. The following table shows this operation in the individual steps:

Also if the data is transmitted from the 74HC166 to the Arduino or ESP8266 microcontroller, the clock line has to be set LOW and HIGH because only in the LOW to HIGH transition, data is transferred.

At this point in the script we know that one or more buttons are pressed and we also know which buttons they are. With an if statement we check if there is a change in the variable and if so we print the decimal and binary value of the dataIn variable to the serial terminal.

At the end of the script there is a delay set to 5000 for debugging or to 500 if you want to run the script more frequently.

The following two picture show the difference in the pull-down and the pull-up configuration. In the pull-down configuration all bits are set to 0 and if a button is pressed, the bit is set to 1. For the pull-down configuration all connected bits are set to 1 and only the bit which is pressed is set to 0. For a better detection you could set all bits to 1 by connecting the open bits not to ground but to the 5V rail. Also you have to change the variable switchVar from 0 to 1 to notice the change of the button that is pulled low.

Shift Register PISO PullDown
Shift Register PISO PullUp

Control multiple LEDs via buttons

Now we put the examples of the SIPO and PISO together in one example. We want to control the LEDs with the buttons. If button 1 is pressed, LED 1 should turn on and so on. I choose the pull-down configuration with only two buttons for this example because all my other buttons which fit on the breadboard are defect but I want to light up a third LED when both buttons are pressed at the same time.

The following picture shows the fritzing sketch of this example where we combine the PSIO and SIPO example. The wiring is shown in the different tabs for the most popular Arduino microcontroller as well as for the ESP8266 and ESP32 microcontrollers.

Click on an image to see the wiring as fullscreen.

Shift Register SIPO PISO PullDown Arduino Nano

Shift Register SIPO PISO PullDown Arduino Nano

Shift Register SIPO PISO PullDown Arduino Pro Mini

Shift Register SIPO PISO PullDown Arduino Pro Mini

Arduino Shift Register SIPO PISO Pull Down

Arduino Shift Register SIPO PISO Pull Down

Shift Register SIPO PISO PullDown Arduino Mega

Shift Register SIPO PISO PullDown Arduino Mega

Shift Register SIPO PISO PullDown EPS32 NodeMCU

Shift Register SIPO PISO PullDown EPS32 NodeMCU

Shift Register SIPO PISO PullDown ESP8266 NodeMCU

Shift Register SIPO PISO PullDown ESP8266 NodeMCU

Shift Register SIPO PISO PullDown ESP8266 WeMos D1 Mini

Shift Register SIPO PISO PullDown ESP8266 WeMos D1 Mini

Because I already explained most of the program code, I will concentrate only on the changes.

// for Arduino Microcontrollers
int latchPin_PISO = 3;
int clockPin_PISO = 4;
int dataPin_PISO = 2;
int latchPin_SIPO = 5;
int clockPin_SIPO = 7;
int dataPin_SIPO = 6;

// for ESP8266 Microcontrollers
//int latchPin_PISO = D6;
//int clockPin_PISO = D5;
//int dataPin_PISO = D7;
//int latchPin_SIPO = D2;
//int clockPin_SIPO = D0;
//int dataPin_SIPO = D1;

// for ESP32 Microcontrollers
//int latchPin_PISO = 18;
//int clockPin_PISO = 19;
//int dataPin_PISO = 5;
//int latchPin_SIPO = 21;
//int clockPin_SIPO = 23;
//int dataPin_SIPO = 22;

int i;
int j;
int value;
byte switchVar = 0;
byte leds = 0;


void setup() {
  pinMode(latchPin_PISO, OUTPUT);
  pinMode(dataPin_PISO, INPUT);  
  pinMode(clockPin_PISO, OUTPUT);

  pinMode(latchPin_SIPO, OUTPUT);
  pinMode(dataPin_SIPO, OUTPUT);  
  pinMode(clockPin_SIPO, OUTPUT);

  Serial.begin(9600);
}

void loop() {
  byte dataIn = 0;
  leds = 0;
  updateShiftRegister();
  
  digitalWrite(latchPin_PISO, 0);
  digitalWrite(clockPin_PISO, 0);
  digitalWrite(clockPin_PISO, 1);
  digitalWrite(latchPin_PISO, 1);
  
  for(j = 0; j < 8; j++) {
    value = digitalRead(dataPin_PISO);
    if (value) {
      dataIn = dataIn | (1 << j);
      }
      digitalWrite(clockPin_PISO, LOW);
      digitalWrite(clockPin_PISO, HIGH);
    }

    if (switchVar != dataIn)
    {
      switchVar = dataIn;
      Serial.print("dataIn DEC: ");
      Serial.print(dataIn, DEC);
      Serial.println();
      Serial.print("dataIn BIN: ");
      Serial.print(dataIn, BIN);
      Serial.println();

      if ((int) dataIn == 192) {
        i = 5;
      }
      else if ((int) dataIn == 128) {
        i = 6;
      }
      else if  ((int) dataIn == 64) {
        i = 7;
      }
      bitSet(leds, i);
      updateShiftRegister();

      for (int i = 7; i >= 0; i--)
    {
        bool b = bitRead(leds, i);
        Serial.print(b);
    }
    
    delay(1000);
    Serial.println(" ");
    }
} 

void updateShiftRegister()
{
   digitalWrite(latchPin_SIPO, LOW);
   shiftOut(dataPin_SIPO, clockPin_SIPO, LSBFIRST, leds);
   digitalWrite(latchPin_SIPO, HIGH);
}

First of all we define the latch, clock and data pin for the PISO and SIPO shift register for the different microcontroller. The script is commented for Arduino microcontrollers. If you want to use an ESP8266 or ESP32 micocontroller, just uncomment the section for the PISO and SIPO pins and comment the Arduino lines.

After we define the PISO and SIPO pins, different variables are defined that we need during the script.

In the setup function the data pin of the PISO register is set as input and all other pins as output. The baud rate is set to 9600.

The loop function starts with the initialization of the dataIn variable to detect which buttons was pressed and set the variable to 0 in each iteration of the loop function because otherwise we do not detect a pressed button more than one time. Also after each cycle we set the leds variable back to 0 and update the shift register with the function we already know from the first example of this tutorial to turn off the LEDs again as well as enable the PISO shift register to read the states from the buttons.

You already know this part of the program from the PISO example. We check for each bit if the corresponding button is pressed and add all states via the bitwise OR operator. After we know which buttons are pressed we print the decimal and binary value to the serial monitor.

Now we combine the SIPO and the PISO example. After we know which button was pressed and the decimal value of this combination, we if else through all possibilities and match the button state with the variable i which lights up the corresponding LED via the bitSet function you also know from the SIPO example.

At the end of the script we print the bit array of the LEDs and wait for 1 second.

The last part of the script is the updateShiftRegister function that we use in the first example.

The following video shows me pressing different buttons to turn on the matching LEDs.

Conclusion

I hope you liked this tutorial and moreover I am happy if you learned how a shift register is working and what different kinds of shift registers are available. If you have any questions regarding this article, please use the comment section below to ask your questions.

If you are also interested how to increase the number of analog pins on your microcontroller which an analog multiplexer, then I can recommend this article.