Visualize MQTT Data with InfluxDB and Grafana
In this tutorial we follow up a first article to build a complete DIY Smart Home indoor weather station.
In this second article we want to save the published messages in an InfluxDB database and create a beautiful dashboard with Grafana.
This step by step tutorial is divided into 3 parts:
- Setup an InfluxDB database
- Create a MQTT Bridge
- Setup Grafana and create the dashboard
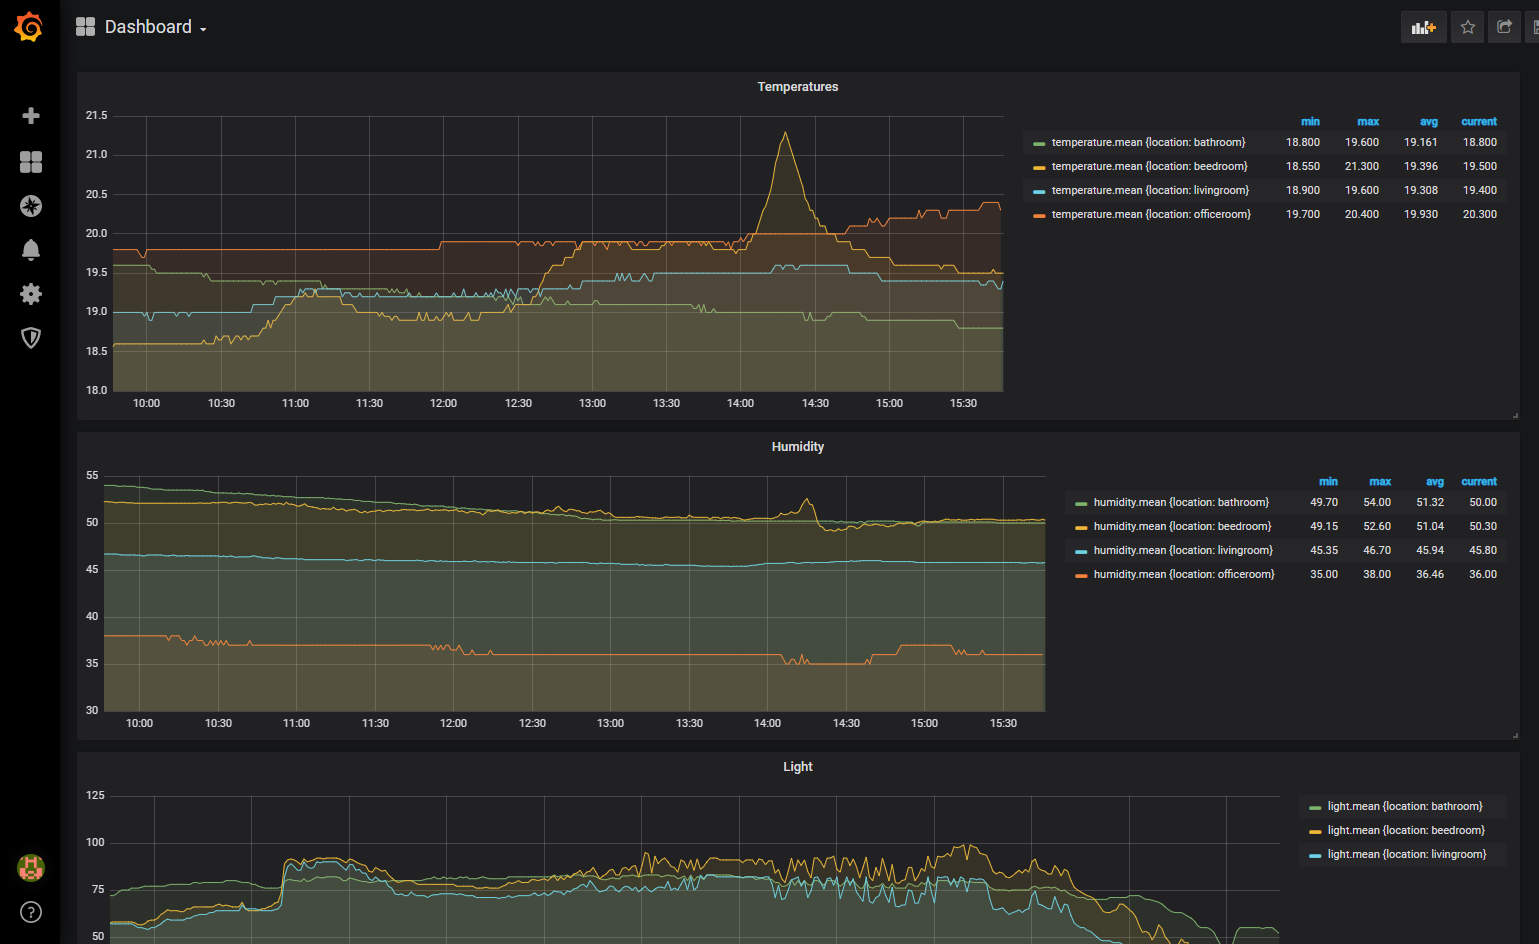
Table of Contents
Let us quickly summarize what we did in the first article in this series.
In this first article we build up a basic MQTT communication with a ESP8266 NodeMCU as publisher, collecting temperature and humidity sensor information. From this publisher we sent the temperature and humidity with a topic and a payload via MQTT to the MQTT broker on a Raspberry Pi. The last step was to build a subscriber as basic python script to show the last entries of the topics.
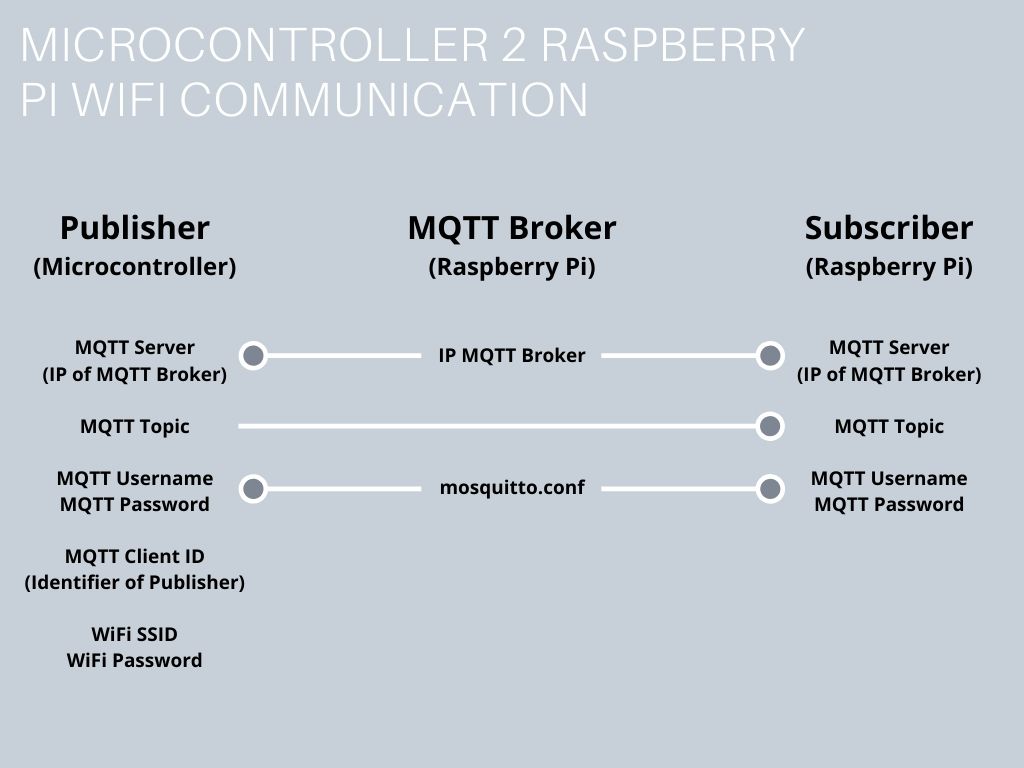
Now we extend our application with a InfluxDB database to store all the sensor data and the visualization tool Grafana to show us nice charts on a dashboard. The following picture shows you the big picture of the communication between all parts of this application.
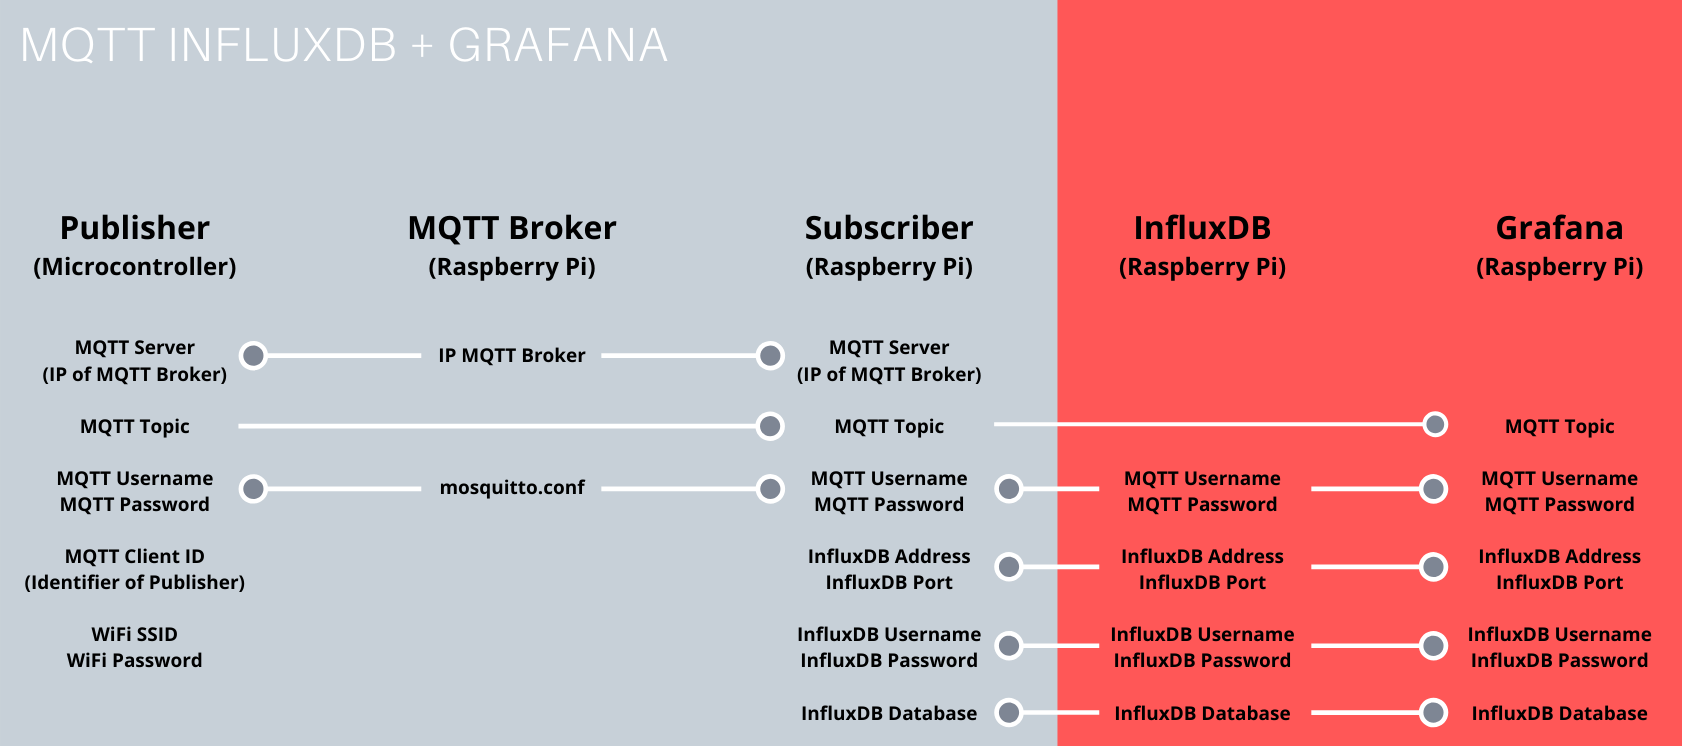
The subscriber will be a little bit different in this article because we want to create a MQTT InfluxDB bridge which stores the MQTT data into the database. First we start with the installation and configuration of the InfluxDB.
The following table gives you an overview of all components and parts that I used for this tutorial. I get commissions for purchases made through links in this table.
InfluxDB Setup
In our example we use InfluxDB to store the data because it is optimized for time series data. Of cause it would also be possible to work with other databases like MariaDB or mongoDB but InfluxDB work right out of the box with Grafana, we use to visualize the data.
If you are new to InfluxDB it makes sense to gain some knowledge about the database system itself. You can read the getting started guide of InfluxDB for example.
The first thing we have to do is to install InfluxDB on the Raspberry Pi. Because the Raspberry Pi is a Linux system the installation is pretty easy. Execute the following 2 commands in the Raspberry Pi terminal.
Install InfluxDB | sudo apt install influxdb |
Install InfluxDB Clients | sudo apt install influxdb-client |
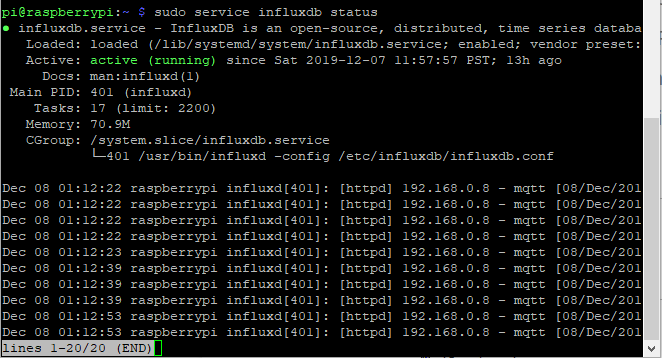
After the successful installation you can start InfluxDB and control the current status with the following commands.
Start InfluxDB Service | sudo service influxdb start |
Get the current status of InfluxDB | sudo service influxdb status |
The current status should be active so that InfluxDB is running.
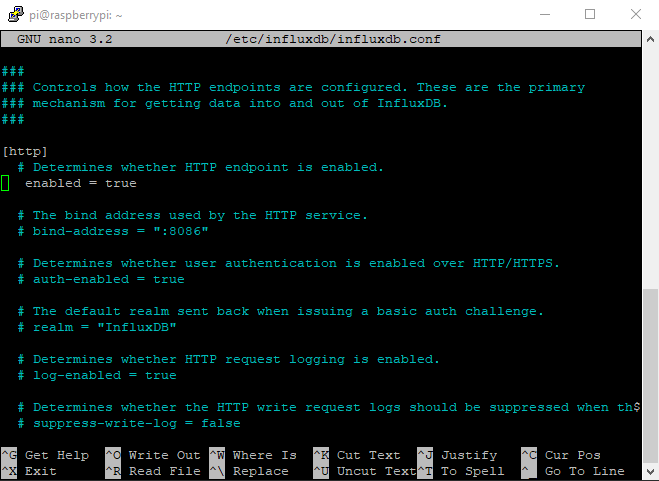
After the installation of InfluxDB we have to make one change in the configuration to enable the HTTP endpoint. This is necessary because we want to write data from the MQTT subscriber to an existing database. To change the configuration, use the following statement.
Open the InfluxDB configuration | sudo nano /etc/influxdb/influxdb.conf |
In the configuration file scroll down with the arrow key on your keyboard to the [http] part of the configuration. Uncomment the first setting by deleting the # on “Determines whether HTTP endpoint is enabled.” and set the enabled = true. Click Ctrl + X, then Y to confirm to save and hit the enter button to save to the existing file.
After every change in the configuration InfluxDB has to be restarted that the changes in the configuration are active. Restart InfluxDB with the following command.
Restart InfluxDB Service | sudo service influxdb restart |
Now the configuration is finished and we create a database where all MQTT information are stored and a user that write the MQTT data to the database.
First start InfluxDB with the following command in the Raspberry Pi terminal
Start InfluxDB | influxdb or influx |
Now we create a new database with whatever name you like. I choose “weather_stations” as name. Tpye in the following commands:
CREATE DATABASE weather_stations
The database is created and now we create a new user and give this user the rights to access the database we created before. I choose mqtt as username and password. Feel free to find a better of saver username and password.
CREATE USER mqtt WITH PASSWORD ‘mqtt’
GRANT ALL ON weather_stations TO mqtt
That was it for the InfluxDB: We installed InfluxDB, get the configuration right and created a database and user for the database.
You exit InfluxDB from the command line with exit.
The next step is to make sure the database is filled with MQTT messages.
Subscriber Setup (MQTT InfluxDB Bridge)
The job of the subscriber is to listen to all MQTT messages, pull out the ones we want to save in the database and save the messages in the right format into the InfluxDB. The bridge between the MQTT broker and the InfluxDB is a python3 script. Therefore we have to make sure that the needed packages are installed for python3. If you have installed Raspberry Pi OS on your Raspberry Pi you have also installed python3. If you have to install Raspberry Pi OS, you find a tutorial in this article. With the following commands you install the MQTT and InfluxDB packages for python3.
Install Python3 MQTT language bindings | sudo pip3 install paho-mqtt |
Install Python3 InfluxDB package | sudo pip3 install influxdb |
Now all python3 packages are installed and we create a new python file called MQTTInfluxDBBridge.
Create the python file for the MQTT subscriber | sudo nano MQTTInfluxDBBridge.py |
The following part of this article describes the python bridge script step by step.
import re
from typing import NamedTuple

import paho.mqtt.client as mqtt
from influxdb import InfluxDBClient

INFLUXDB_ADDRESS = '192.168.0.8'
INFLUXDB_USER = 'mqtt'
INFLUXDB_PASSWORD = 'mqtt'
INFLUXDB_DATABASE = 'weather_stations'

MQTT_ADDRESS = '192.168.0.8'
MQTT_USER = 'cdavid'
MQTT_PASSWORD = 'cdavid'
MQTT_TOPIC = 'home/+/+'
MQTT_REGEX = 'home/([^/]+)/([^/]+)'
MQTT_CLIENT_ID = 'MQTTInfluxDBBridge'

influxdb_client = InfluxDBClient(INFLUXDB_ADDRESS, 8086, INFLUXDB_USER, INFLUXDB_PASSWORD, None)

class SensorData(NamedTuple):
    location: str
    measurement: str
    value: float

def on_connect(client, userdata, flags, rc):
    """ The callback for when the client receives a CONNACK response from the server."""
    print('Connected with result code ' + str(rc))
    client.subscribe(MQTT_TOPIC)

def _parse_mqtt_message(topic, payload):
    match = re.match(MQTT_REGEX, topic)
    if match:
        location = match.group(1)
        measurement = match.group(2)
        if measurement == 'status':
            return None
        return SensorData(location, measurement, float(payload))
    else:
        return None

def _send_sensor_data_to_influxdb(sensor_data):
    json_body = [
        {
            'measurement': sensor_data.measurement,
            'tags': {
                'location': sensor_data.location
            },
            'fields': {
                'value': sensor_data.value
            }
        }
    ]
    influxdb_client.write_points(json_body)

def on_message(client, userdata, msg):
    """The callback for when a PUBLISH message is received from the server."""
    print(msg.topic + ' ' + str(msg.payload))
    sensor_data = _parse_mqtt_message(msg.topic, msg.payload.decode('utf-8'))
    if sensor_data is not None:
        _send_sensor_data_to_influxdb(sensor_data)

def _init_influxdb_database():
    databases = influxdb_client.get_list_database()
    if len(list(filter(lambda x: x['name'] == INFLUXDB_DATABASE, databases))) == 0:
        influxdb_client.create_database(INFLUXDB_DATABASE)
    influxdb_client.switch_database(INFLUXDB_DATABASE)

def main():
    _init_influxdb_database()

    mqtt_client = mqtt.Client(MQTT_CLIENT_ID)
    mqtt_client.username_pw_set(MQTT_USER, MQTT_PASSWORD)
    mqtt_client.on_connect = on_connect
    mqtt_client.on_message = on_message

    mqtt_client.connect(MQTT_ADDRESS, 1883)
    mqtt_client.loop_forever()


if __name__ == '__main__':
    print('MQTT to InfluxDB bridge')
    main()
At the start of the script we load all packages we use:
- re: Identify the MQTT topic with a corresponding matching pattern
- NamedTuple: Create Name Tuples for the right dtype
- MQTT: Access MQTT broker
- InfluxDB: Access InfluxDB database
After all packages are loaded the InfluxDB variables are defined. The Address is the IP of the Raspberry Pi. The username name and password are the same we defined in the setup of the InfluxDB and the name of the database is where we want to store our data.
The MQTT variables are in parts the same as the first article in this series. It is important to follow the path structure using wildcards after the home folder. This is because I use the following structure:
- home
- livingroom
- temperature
- humidity
- bathroom
- temperature
- …
- livingroom
Therefor I need in total a depth of 3 in my path structure. So for your publisher you have to define the topics like:
const char* humidity_topic = “home/livingroom/humidity”;
const char* temperature_topic = “home/livingroom/temperature”;
If you want to download the Arduino script, use the following download button to get the complete script.
Due to the variable MQTT_REGEX and the python package “re” it is possible to identify the wildcards.
I create a class called SensorData to get the correct dtypes of the variables for the location, measurement and value:
The on_connect function handle what happens when the MQTT client connects to the broker. If our clients connects to the broker we want to subscribe to all topics which starts with “home” and print the message that the connection was established. The variable rc holds and error code if the connection is not successful so the debugging is easier.
The function _parse_mqtt_message reads the location, measurement and the sensor data from the topic path structure and identifies the variables. The function returns the variables as NamedTuple.
The function _send_sensor_data_to_influxdb gets the variables as NamedTuple as input and create a json structure which will later fits to the query in Grafana. The measurement is saved directly. The location is stored in a tag structure and the value also nested in a field variable. In the last step the json structure is written to the InfluxDB database.
The on_message function is called every time the topic is published to. In this case the topic and the message payload is saved to the two variables and printed to the terminal. Also we use the function _parse_mqtt_message to get the location, measurement and value as NamedTuple. If the sensor data is not empty we use the function _send_sensor_data_to_influxdb to store the sensor data into the InfluxDB database.
The function _init_influxdb_database initializes the InfluxDB database. If the database does not exist, it will be created through the function.
This is the main part of the python script where all defined function are executed. First the database is initialized. Then we create a client object and set the username and password for the MQTT client. We tell the client which functions are to be run on connecting, and on receiving a message.
Once everything has been set up, we can connect to the broker with the broker IP, port and keep alive interval.
Once we have told the client to connect, let the client object run itself with the loop forever function.
Click Ctrl + X, then Y to confirm to save and hit the enter button to save to the existing file.
Test MQTT InfluxDB Bridge
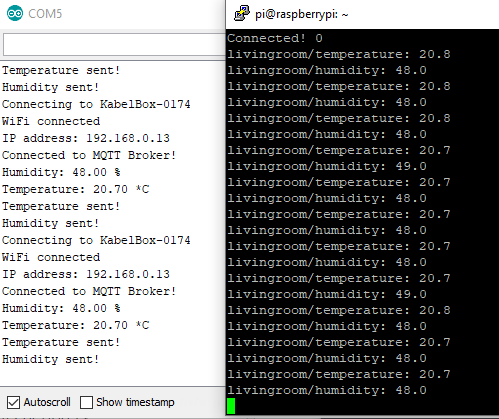
Now we test if everything is running correctly. Run python3 MQTTInfluxDBBridge.py and watch the terminal if you receive data. You should see the temperature and humidity in the terminal like the following picture.
Before we continue the tutorial, we have to make sure that the values from the weather station are saved to the InfluxDB. Therefore we start InfluxDB with the known command: influx.
To enter the database we created before use the following command: USE weather_stations
The first thing we want to make sure is, that all variables are stored. In our example the variables are the temperature and the humidity. In InfluxDB we use the following command: SHOW measurements
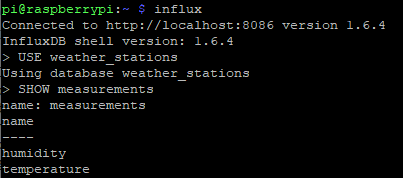
We see that the measurements humidity and temperature are stored in the weather_stations database.
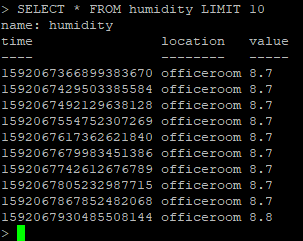
Now I also want to make sure that the sublocation and the value are stored. Therefore we use the following SQL statement to see the last 10 entries of the humidity measurement.
Run MQTT InfluxDB Bridge at Startup
At this point of the tutorial we know that our script is running correctly we want to run it not only if we are logged in to our Raspberry Pi. Now I show you how you can define that the python script is running when the Raspberry Pi starts. Therefor we use a shell script which we execute as cron job when the Raspberry Pi is starting.
First we create the shell script with the following command.
Create shell script | nano launcher.sh |
The following script will wait for 60 seconds because in my case I got the problem that during the startup the connection to the database was not possible. After I included the short pause, the script runs without any problems.
After the pause we navigate into the main folder where the python script is and execute the script with python3.
#!/bin/sh
# launcher.sh

sleep 60

cd /
cd home/pi
sudo python3 MQTTInfluxDBBridge.py
cd /
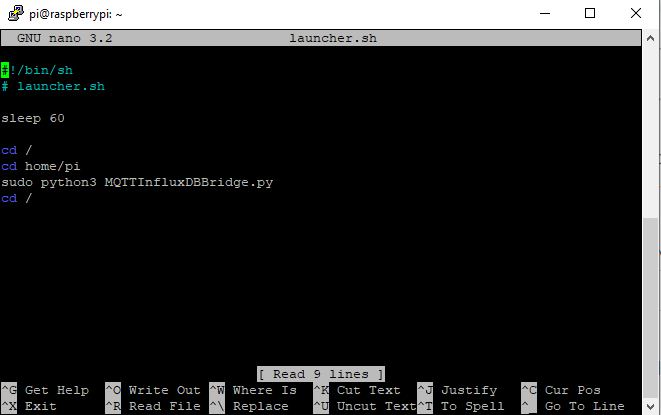
Press Cntl-X, return to save. Now we have to make the script executable. Use the following statement.
Makes the shell script executable | chmod 755 launcher.sh |
If there occur errors we want to save the error logs for debugging the application. We create a new dictionary and save the logs in a separate folder.
Create new folder to save error logs | mkdir logs |
The last and final step is to add the shell script to crontab. Crontab is a background process that is able to execute scripts at defined times. Type in the following command to open crontab.
Open crontab | sudo nano crontab -e |
Add the following line to execute your shell script:
@reboot sh /home/pi/launcher.sh >/home/pi/logs/cronlog 2>&1
Press Cntl-X, return to save. Now we can reboot the Raspberry Pi. There should be no errors but if so than you can open the log files with the following command.
Open error logs from contab | cd logs |
The last part of this tutorial is the Grafana setup to create beautiful charts and dashboards from you saved MQTT data.
Grafana Setup
To install grafana first we have to look after the latest version: https://github.com/grafana/grafana/releases
In my case version 6.5.1 is the newest version. To install grafana, use the following commands.
Install Grafana on the Raspberry Pi with version 6.5.1 | wget https://dl.grafana.com/oss/release/grafana_6.5.1_armhf.deb sudo dpkg -i grafana_6.2.2_armhf.deb sudo apt-get update sudo apt-get install grafana |
After the installation you can start the grafana server.
Start Grafana | sudo service grafana-server start |
You can access the Grafana GUI (graphical user interface) on port 3000. Typ in your browser the combination of the IP of your Raspberry Pi and the port. In my case it is
Access Grafana GUI with your browser | 192.168.0.8:3000 |

Use the following combination for your first login:
- Default username: admin
- Default password: admin
During your first login you have to change the password. Use a password you like and continue.
Now you choose your default data sources. Of cause we use InfluxDB. Now we have to setup the settings for the connection to the InfluxDB:
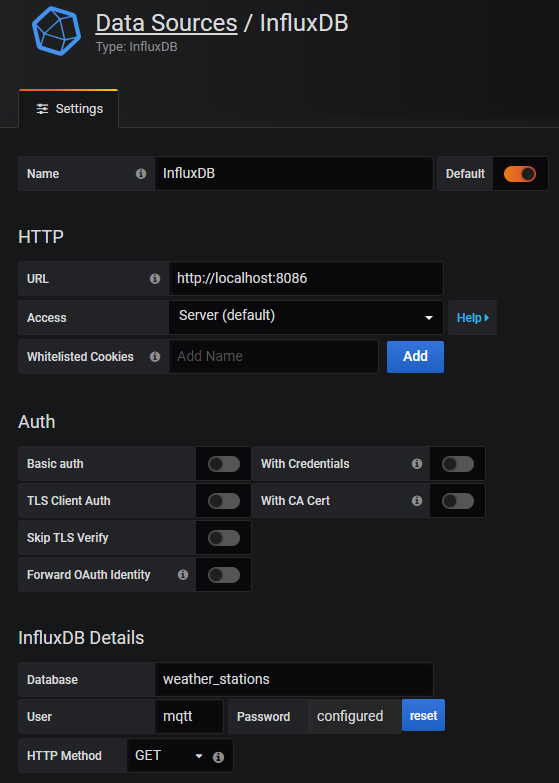
- URL: http://localhost:8086
Use the localhost because the InfluxDB is on the same Raspberry Pi installed. The InfluxDB can be accessed on port 8086.
If you get an gateway error, try to use the IP of your Raspberry Pi instead of the localhost. In my example, the URL would be http://192.168.0.8:8086 - Database: weather_stations
Use the name of the database where the MQTT data is stored. In my case I named the database “weather_stations”. - User: mqtt
Here we use the user we created during the setup of the InfluxDB. - Password: mqtt
Here we use the user we created during the setup of the InfluxDB.
At the bottom of the site you can save and test the connection. You should get a message that the data source is working.
On the left menu panel you can choose the “Explore” button where you define SQL queries to get an overview about your data.
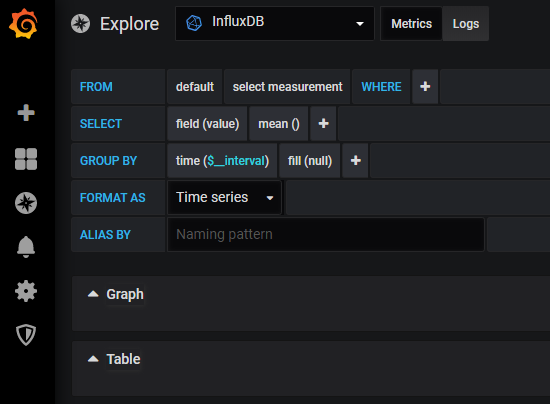
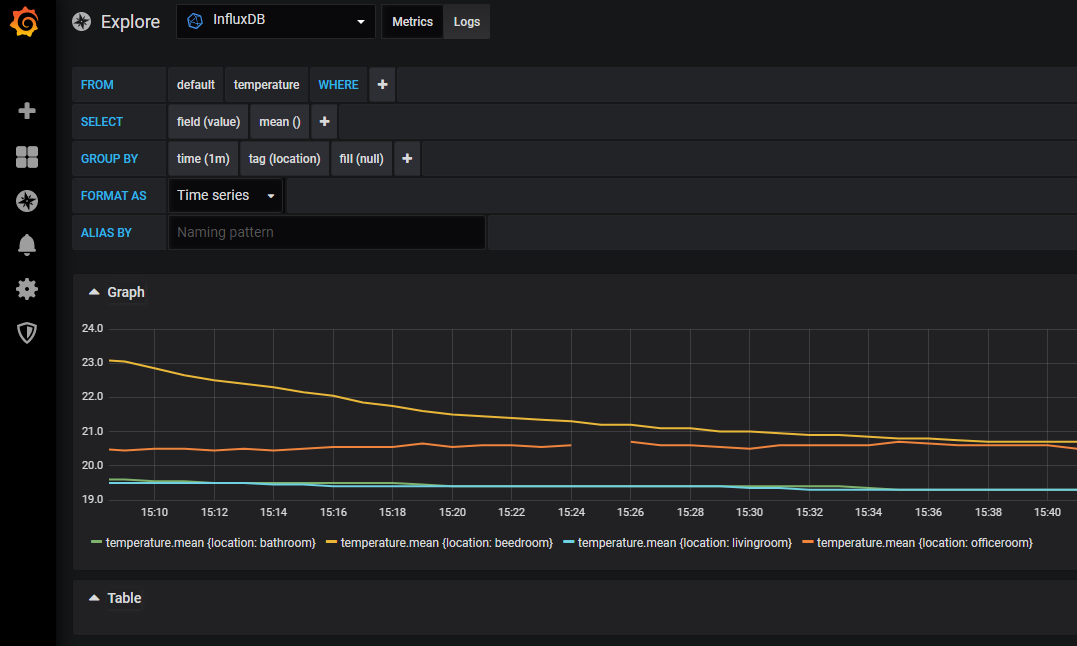
As measurement we can select the temperature for example. Use the GROUP BY time to get a curve instead of dots. For example I choose to group by a time of 1 minute. Also I want to group by the tag (location) to get not one curve but one curve for every weather station I have in my apartment.
The following picture shows you the visualization of the temperature of my four temperature sensors.
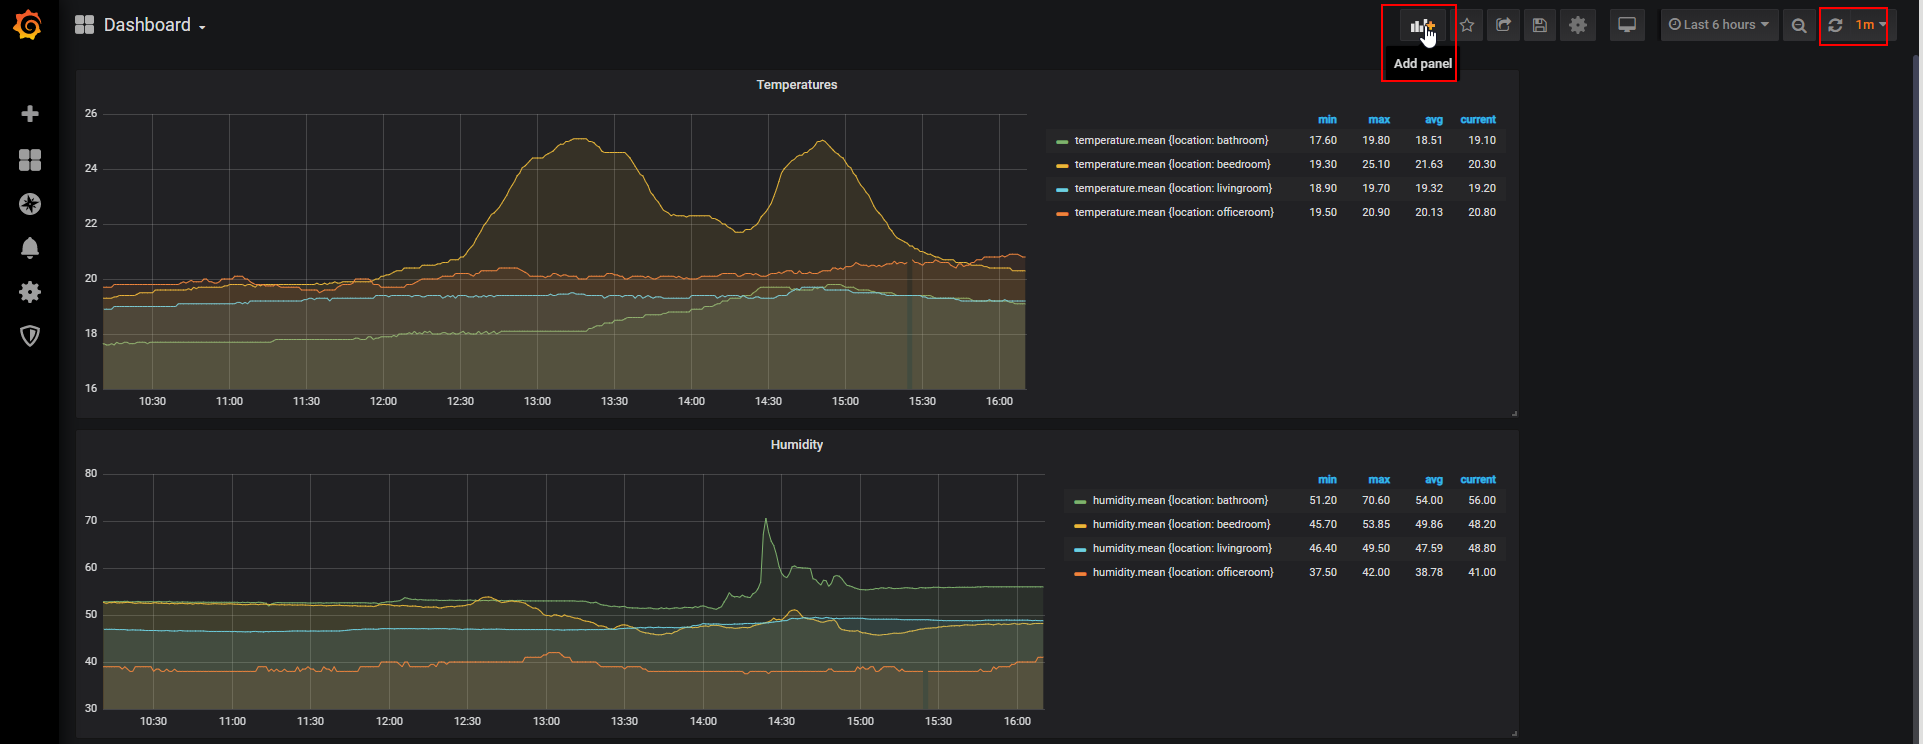
If you want to create visualizations for your dashboard click the add panel button on the top (see the following picture) and define your custom SQL query. It would be too much to explain every single detail of Grafana in this article but you should active the auto refreshing also on the top as last button. I choose to refresh the dashboard every minute.
Feel free to explore Grafana for yourself. But If you struggle at some point or if you have any questions, use the comment section below and I will answer your questions as soon as possible.
Are you are interested in a whole section of articles related to MQTT, Home Assistant, InfluxDB and Grafana? The following picture shows the structure of in total 5 articles in this series.
Beautiful tutorial. But i’m having the issue that apparently no data is inserted in my database as grafana doesn’t show me my topics like voltage, current or power. Any suggestions on how to fix or check the input data?
Hi Chris,
do you see any data in your influxDB? If there is no data in the database, the problem should be in the MQTT_InfluxDB_Bridge script. But if you see data in the database, then the error is in the grafana setup.
If you check that then I will help you to find the error.
Best,
Christopher
Wonderful tutorial, bonus points for using authentication. Only thing I would add are references (getting started, ..) for components you’ve used, like influxdb, e. g.: https://docs.influxdata.com/influxdb/v1.7/introduction/getting-started/
Thanks!
Hi Marcus,
thanks for your positive feedback and you are absolute right. I put the link to the getting started guide for InfluxDB in the article.
Hi, I’d love to get some help on the Influxdb part and the url seems a good start but I was lost there. I followed this tutorial and work to the point and install grafana, login in. But when I tried to see the temperature plot, I got a message “the query return no data for the table”.
I’ve trying last few days looking some way to figure if the MQTTInfluxDBBridge.py actually is populating the database (since there is no error so I assume it is working) but not able to.
Also, is there a way to export the data from Influxdb to csv file so I can do some post analysis?
Thanks,
Hello,
I’m trying to run youre script. But I get an error on line 23
caesar@debian-mini-itx:~/bin$ python MQTTInfluxDBBridge.py
File “MQTTInfluxDBBridge.py”, line 23
location: str
class SensorData(NamedTuple):

    location: str

    measurement: str

    value: float
It’s the
location: str
that gives the error. I have innstalled every thing thats listed with pipe.
caesar@debian-mini-itx:~$ sudo pip3 install paho-mqtt
[sudo] password for caesar:
Requirement already satisfied: paho-mqtt in /usr/local/lib/python3.5/dist-packages
caesar@debian-mini-itx:~$ sudo pip3 install influxdb
Requirement already satisfied: influxdb in /usr/local/lib/python3.5/dist-packages
Requirement already satisfied: python-dateutil>=2.6.0 in /usr/local/lib/python3.5/dist-packages (f rom influxdb)
Requirement already satisfied: six>=1.10.0 in /usr/local/lib/python3.5/dist-packages (from influxd b)
Requirement already satisfied: requests>=2.17.0 in /usr/local/lib/python3.5/dist-packages (from in fluxdb)
Requirement already satisfied: pytz in /usr/local/lib/python3.5/dist-packages (from influxdb)
Requirement already satisfied: idna=2.5 in /usr/local/lib/python3.5/dist-packages (from reques ts>=2.17.0->influxdb)
Requirement already satisfied: chardet=3.0.2 in /root/.local/lib/python3.5/site-packages (from requests>=2.17.0->influxdb)
Requirement already satisfied: certifi>=2017.4.17 in /usr/local/lib/python3.5/dist-packages (from requests>=2.17.0->influxdb)
Requirement already satisfied: urllib3!=1.25.0,!=1.25.1,=1.21.1 in /usr/local/lib/python3.5 /dist-packages (from requests>=2.17.0->influxdb)
Can you give me som hints on what to do next
I use Debian 9.12
Thank you for youre work on making a good how to.
Hi,
it could be that your topics are not defined correctly. On your Arduino or EPS8266 microcontroller, what topic du you use?
It is like the one in the example?: const char* humidity_topic = “home/livingroom/humidity”;
I had the same issue. it is a python3 problem. I had the same error with python 3.5 but on an other system with python 3.6.x it worked.
Hi there,
I have the same problem
Hello,
I’m trying to run youre script. But I get an error on line 23
caesar@debian-mini-itx:~/bin$ python MQTTInfluxDBBridge.py
File “MQTTInfluxDBBridge.py”, line 23
location: str
class SensorData(NamedTuple):
location: str
measurement: str
value: float
It’s the
location: str
The arduino code is like yours, so I have no idea what is going wrong..
Although thanks for ypur nice post
Hi,
can you please send your Arduino code to contact@diyi0t.com?
I will make sure that your code is running.
Best, Christopher
I’ll share my experience here. I had the same problem originally but solve it by: chown to user (instead of root) and then use python3 instead of python and it worked.
Thank you very much for this tutorial.
It works like a charm !
Keep on the good work.
Hi Pierre,
good to hear that everything works well. Over the last couple days I wrote in total 3 new articles about Home Assistant, InfluxDB and Grafana. So stay tuned 🙂
Hi,
Thank you for this tutorial.
I install influxdb but after I can’t install influxdb-client, I have this error:
attempt to replace ‘/usr/bin/influx’, which also belongs to the influxdb 1.8.0-1 package
If I remove the influxdb package I can install the client but can’t start the service
Can you help please.
Hi Jerome,
I can not reconstruct your error. I setup the Raspberry Pi as described in this article: https://diyi0t.com/raspberry-pi-headless-setup-tutorial/
Then I installed InfluxDB with
sudo apt install influxdband Install InfluxDB Clients withsudo apt install influxdb-client.I do not see any errors.
I use raspbian buster (10).
If I juste use the repository provided with the OS, when I start Influx I don’t have the prompt.
So I use the debian installation found on the official web (https://docs.influxdata.com/influxdb/v1.8/introduction/install/).
And now I can start influx and have the prompt.
But installation of the client fail.
Maybe I restart from a fresh install.
Hi, thanks for the tutorial. It has been great so far. Unfortunately I have an issue with the MQTTInfluxDBBridge.py. When trying to start script I get various issues with the syntax:
python3 MQTTInfluxDBBridge.py
File “MQTTInfluxDBBridge.py”, line 37
if sensor_data is not None:
^
SyntaxError: invalid syntax
As a workaround I deleted this line and when I tried to start the scriptI got a different syntax issue in line 40. Do you have any idea where this might come from?
Hi Kim,
looks to me like a formatting error when you copied the lines of code. Do you downloaded the Python file or copied the lines of code?
Deleting this line of code is not an option because it starts an if query.
Best, Christopher
hi,
when I try to setup Data Source, it gives me an error of Bad Gateway(502).
I tried to solve but it does not help.
Hi Bhargav,
try not to use localhost as your URL but the IP of the Raspberry Pi instead followed by the Port.
In my example, the URL would be http://192.168.0.8:8086
Thank you, It’s Working well.
Great Work.
Telegraf supports subscribing to an MQTT topic and outputting to InfluxDB. Why not use this?
Hi Anonymous,
yes Telegraf can also be the MQTT InfluxDB Bridge. When I find time I will update this article so that everyone can decide if they use the Python bridge or Telegraf. In the meantime you can also use Home Assistant as described in the Home Assistant MQTT Tutorial
Thanks for this tutorial! Managed to get it up and running in Windows and visualising a device connected to the eclipse public mqtt broker. In the python script, I simply had to remove the credentials and change the client id to something unique to prevent disconnections due to other clients connecting as MQTTInfluxDBBridge.
Hello John, I’m happy to hear that the tutorial worked without any problems for you.
Great write up and easy to follow. Looks like my previous comment was not posted so here is another ask for help. I followed the instruction and was able to setup MQTTInfluxDBBridge and there was no error. Grafana setup ok but when I add tag(location), the message was “the queries returned no data for a table”. I tried to debug and I can see MQTT message and the bridge scripts return 0 (no error). However, I don’t know how to check if the data ever get post into Influxdb? The data source setup in Grafana during save & test was ok so I suspect either I am not storing the data or somehow not able to get it to Grafana. Any suggest/hint to help debug the problem? Thanks,
Hi – great tuto – Thank you for sharing!
Unfortunately, when I run
pi@raspberrypi:~ $ python3 MQTTInfluxDBBridge.py.
I can see:
MQTT to InfluxDB bridge
Connected with result code 0
Then nothing is showing up on the screen (no data) as well as in grafana.
But I can see data data on the screen when I run:
pi@raspberrypi:~ $ python get_MQTT_data.py
Connected! 0
livingroom/temperature: 0.3
livingroom/humidity: 2.3
livingroom/temperature: 0.3
livingroom/humidity: 2.3
Any idea what I did wrong?
Thank you,
Best!
Hi Francois, I changed the tutorial a little bit this weekend because some readers have trouble get the program running. What is your topics in the Arduino script look like? Hey have to match is logic: const char* humidity_topic = “home/livingroom/humidity”;
Perfect! Works like a charm.
I am loving it.
Thanks so much for sharing!
Best!
@LeonardT – I had the same issue and realize that I need to update the code running on your esp8266 regarding topic names to:
const char* humidity_topic = “home/livingroom/humidity”;
const char* temperature_topic = “home/livingroom/temperature”;
I keep getting error ModuleNotFoundError: No module named ‘influxdb’
Hi Bhavik,
do you have Python 3 installed or a 2.X Version? Did you install influxdb with the following command: sudo pip3 install influxdb
I get the same error an a clean install. Can connect to influxdb via the influx command and manually create, view and edit databases. Can also connect to grafana and connect to the db, but when trying to execute examples where from anywhere with ‘from influxdb import influxDBClient’ I get this:
Traceback (most recent call last):
File “/home/pi/mu_code/testinflux.py”, line 11, in
from influxdb import InfluxDBClient
ModuleNotFoundError: No module named ‘influxdb’
Took my quite some time to figure this out but I think that I got the solution.
If you installed the packages with sudo pip3 … then you are install the packages for the root user and for python3.
If I start python with “python” in the command line I run python 3.X but get the same error.
If I start python with “python3” in the command line I also run python 3.X but get no error.
Nice article, looks like the exact same as http://nilhcem.com/iot/home-monitoring-with-mqtt-influxdb-grafana
You don’t need a Pi Subscriber between InfluxDB and the MQTT broker. You can connect the Broker straight to InfluxDB via telegraf
Hi Steve,
yes Telegraf can also be the MQTT InfluxDB Bridge. When I find time I will update this article so that everyone can decide if they use the Python bridge or Telegraf.
Installed influxdb and grafana without problems and can run influx and grafana and connect to the datasource in grafana.
But when trying to run a py file the with standard example I get the below.
What can be the problem. Raspberry Pi 3+ with Buster Full image
Traceback (most recent call last):
File “/home/pi/mu_code/testinflux.py”, line 11, in
from influxdb import InfluxDBClient
ModuleNotFoundError: No module named ‘influxdb’
Took my quite some time to figure this out but I think that I got the solution.
If you installed the packages with sudo pip3 … then you are install the packages for the root user and for python3.
If I start python with “python” in the command line I run python 3.X but get the same error.
If I start python with “python3” in the command line I also run python 3.X but get no error.
Hi, thanks for your job, for me “sudo nano crontab -e” create a new file crontab, nano was not required to add the cronjob
Beautiful article. I add that youbcan replace the Putin script with telegraf+mqtt.input.
Hey, I want to connect Grafana with Telegram, there is a way to do that? Like receive the graph on Telegram or a screenshot from Grafana?
Thank you
If youre having trouble with (new format),
”
class SensorData(NamedTuple):
location: str
measurement: str
value: float
”
replace with this line instead (old format).
”
SensorData = NamedTuple(‘SensorData’, [(‘location’,str),(‘measurement’, str), (‘value’, float)])
”
Hello
I am setting up the complete Docker stack for home assistant, MQTT, InfluxDB + Grafana, is there a single compose file to setup this complete stack. I find it too hard to follow all different instructions and set them up using Docker
Hi Nazir,
I know that installing all the docker containers is a pain. Therefore I add this problem to my article list to provide a solution for this problem in the future.
Hello, thank you for the good tutorial. I am having trouble reading data from multiple locations, with several esp8266 boards. It most only gets data from one location, with occasional spikes from the other rooms. The room that it focuses on is random. All the esp8266 boards work individually, but reading the data and saving it to influxdb from multiple locations is causing the issue. Here is an example of my log:
Connected with result code 0
lab/loc1/temperature b’ 20.31′
lab/loc3/temperature b’ 22.88′
lab/loc3/humidity b’ 50.00′
lab/loc3/temperature b’ 22.88′
lab/loc3/humidity b’ 50.00′
lab/loc3/temperature b’ 22.88′
lab/loc3/humidity b’ 50.00′
lab/loc1/temperature b’ 20.89′
lab/loc2/temperature b’ 19.21′
lab/loc3/temperature b’ 22.88′
lab/loc3/humidity b’ 50.00′
lab/loc3/temperature b’ 22.88′
lab/loc3/humidity b’ 50.00′
lab/loc3/temperature b’ 22.88′
lab/loc3/humidity b’ 50.00′
You can see it has occasional readings from loc1 and loc2, but primarily only from loc3. Thank you.
Thanks for the tutorial: very useful.
You have to install the Home Assistant via manual Supervised installer. This Installation method allows you to use Add-ons and other benefits of HASSIO (are included addons: mqtt, grafana, InfluxDB ) in just one docker.