Home Assistant MQTT Tutorial
In this tutorial you learn how to use Home Assistant in general and especially with MQTT data.
Moreover we save the MQTT data in an InfluxDB database before creating beautiful time series dashboards with Grafana.
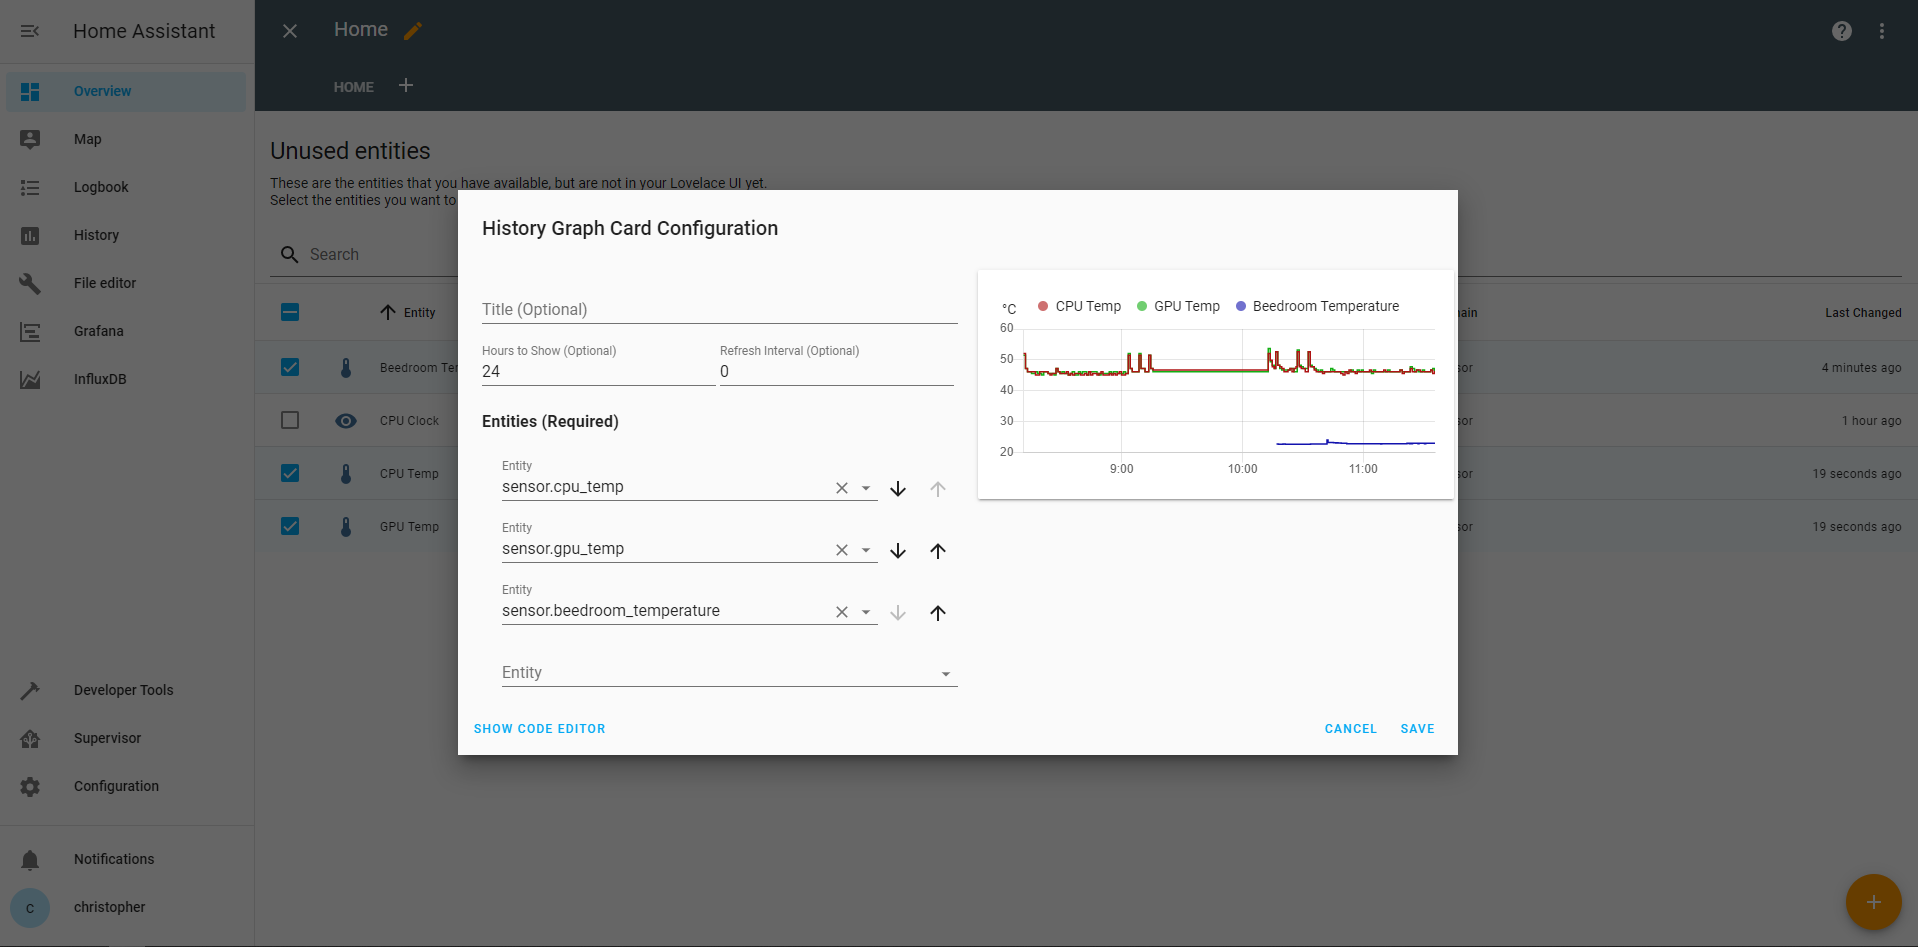
Table of Contents
Home Assistant is an open source house automation software that combines nearly all of your smart home devices in one system. With the help of Home Assistant you can control and automate devices that are not compatible on their own. Home Assistant runs on different systems like your Raspberry Pi or local servers like a Synology Nas.
There are in total 1574 (retrieved: 11.04.2020) integrations for Home Assistant. The most used are:
Amazon Alexa, Ecobee, ESPHome, Google Assistant, Google Cast, IFTTT, IKEA TRADFRI, MQTT, Philips Hue, Plex Media Server, Smartthings, Sonos, Z-Wave, Zigbee Home.
Generally there are two different ways how to setup Home Assistant. The first one is to install HASS.io on your Raspberry Pi as operating system. Therefore Raspbian Buster is not installed on the Pi. The second way is to install Home Assistant via a Docker container.
For this tutorial I assume that you have Home Assistant running and also installed the following addons either via docker or the internal add-on store of Home Assistant:
- Mosquitto MQTT broker
- InfluxDB
- Grafana
If you still have to install all the programs, no problem. There are in total 5 article in this series as the following picture shows. You can easy switch to one article and come back later.
The following table gives you an overview of all components and parts that I used for this tutorial. I get commissions for purchases made through links in this table.
But for a smart home system, Home Assistant is not the only tool that we want to use. We also need an external MQTT broker to receive and send MQTT messages because the embedded MQTT broker of Home Assistant is deprecated. In this tutorial we use Eclipse Mosquitto as lightweight open source MQTT server.
In Home Assistant you can view measurements like temperatures as time series charts but in my opinion these charts are not very beautiful. Also the raw data is only saved for a certain time and not persistent. Therefore we use the combination of InfluxDB to store all MQTT measurements and Grafana to create beautiful time series charts. I also used InfluxDB and Grafana without Home Assistant to display MQTT data in this article.
MQTT Weather Station
To work with MQTT data in Home Assistant we first need an MQTT client that sends data to the Mosquitto MQTT broker. If you do not know what MQTT is or how MQTT works, there is also an MQTT tutorial. In a previous tutorial I build an indoor weather station that measures the temperature, humidity and the intensity of the light and sends there measurements every minute via the MQTT protocol to a Raspberry Pi with Mosquitto installed as MQTT broker. In my opinion it does not make any sense to copy the article here again. Therefore if you do not already have an MQTT client, you can build the same indoor weather station like I did in this article.
In the Arduino script you only have to make sure that some of the constants are the properly set like you see in the following table:
Show MQTT Measurements in Home Assistant
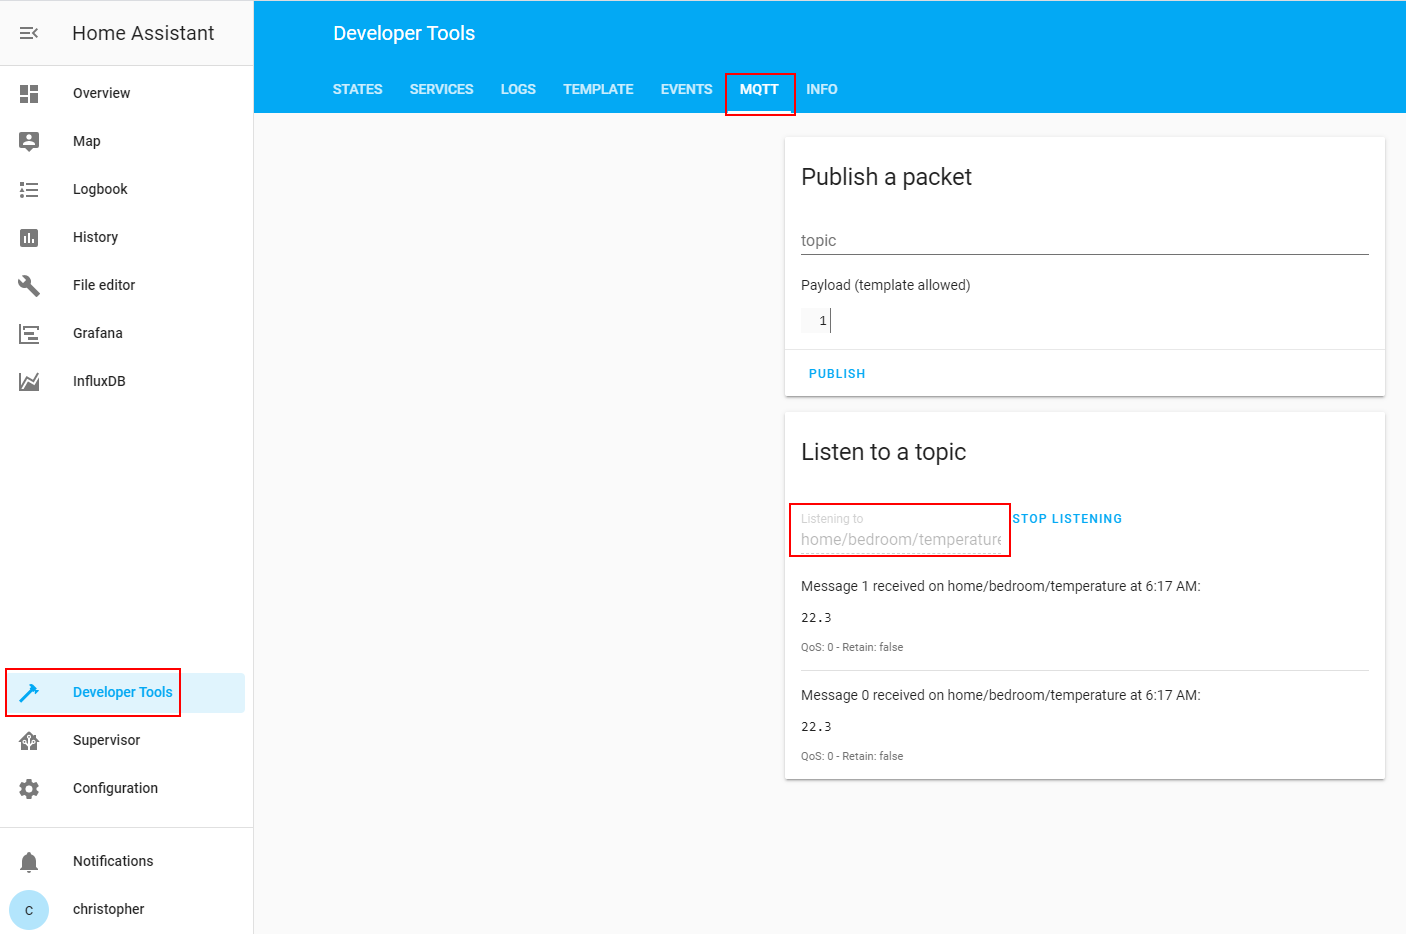
Before we start to visualize the MQTT data in Home Assistant, we have to make sure that the data from the weather station is received from Mosquitto. In Home Assistant there is an easy way to listen to a specific MQTT topic. Under the sidebar section Developer Tools you find the MQTT application were you can temporary subscribe to a MQTT topic. In my case I defined a topic in the Arduino code of the weather station: home/bedroom/temperature. When I insert this topic and click on the start listing button I see that Home Assistant is able to receive the messages from the MQTT client.
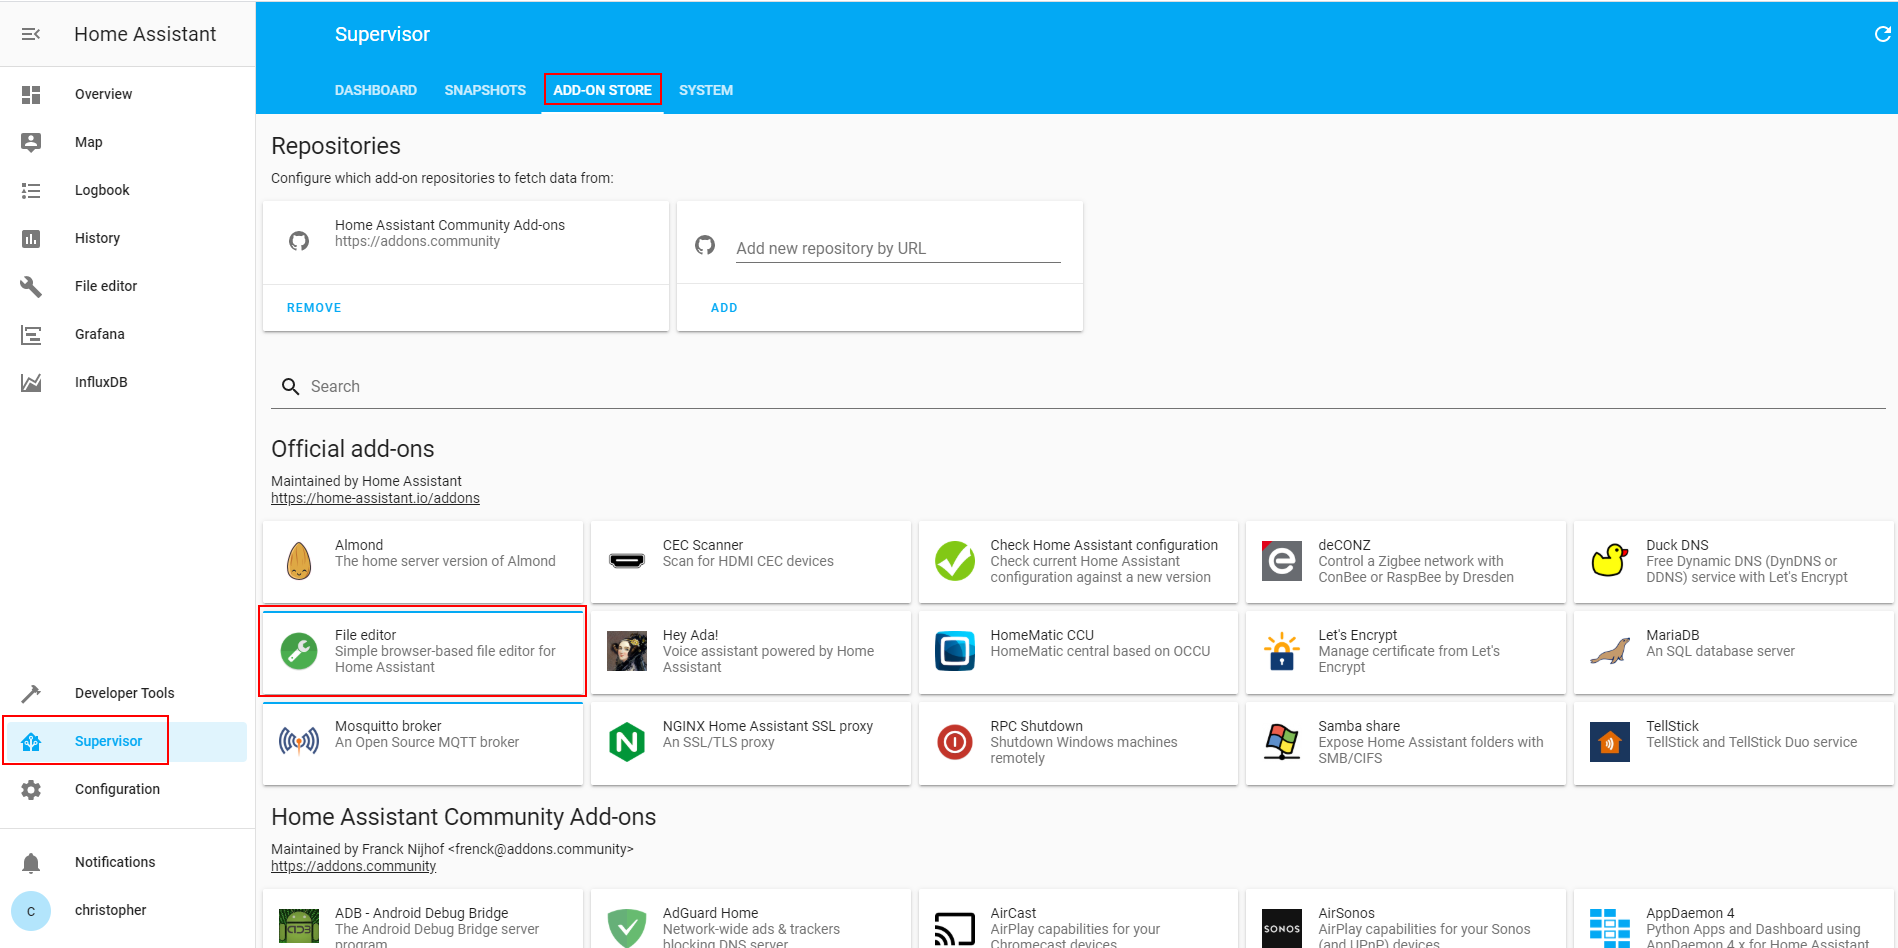
Now we need to configure Home Assistant that the system is continually listen to one or more MQTT topics. Therefore we have to change the configuration file of Home Assistant. The easiest way is to install another add-on in the add-on store called “File editor”. This application let you access and change all files on the Raspberry Pi. Enable the option to view the file editor in the sidebar.
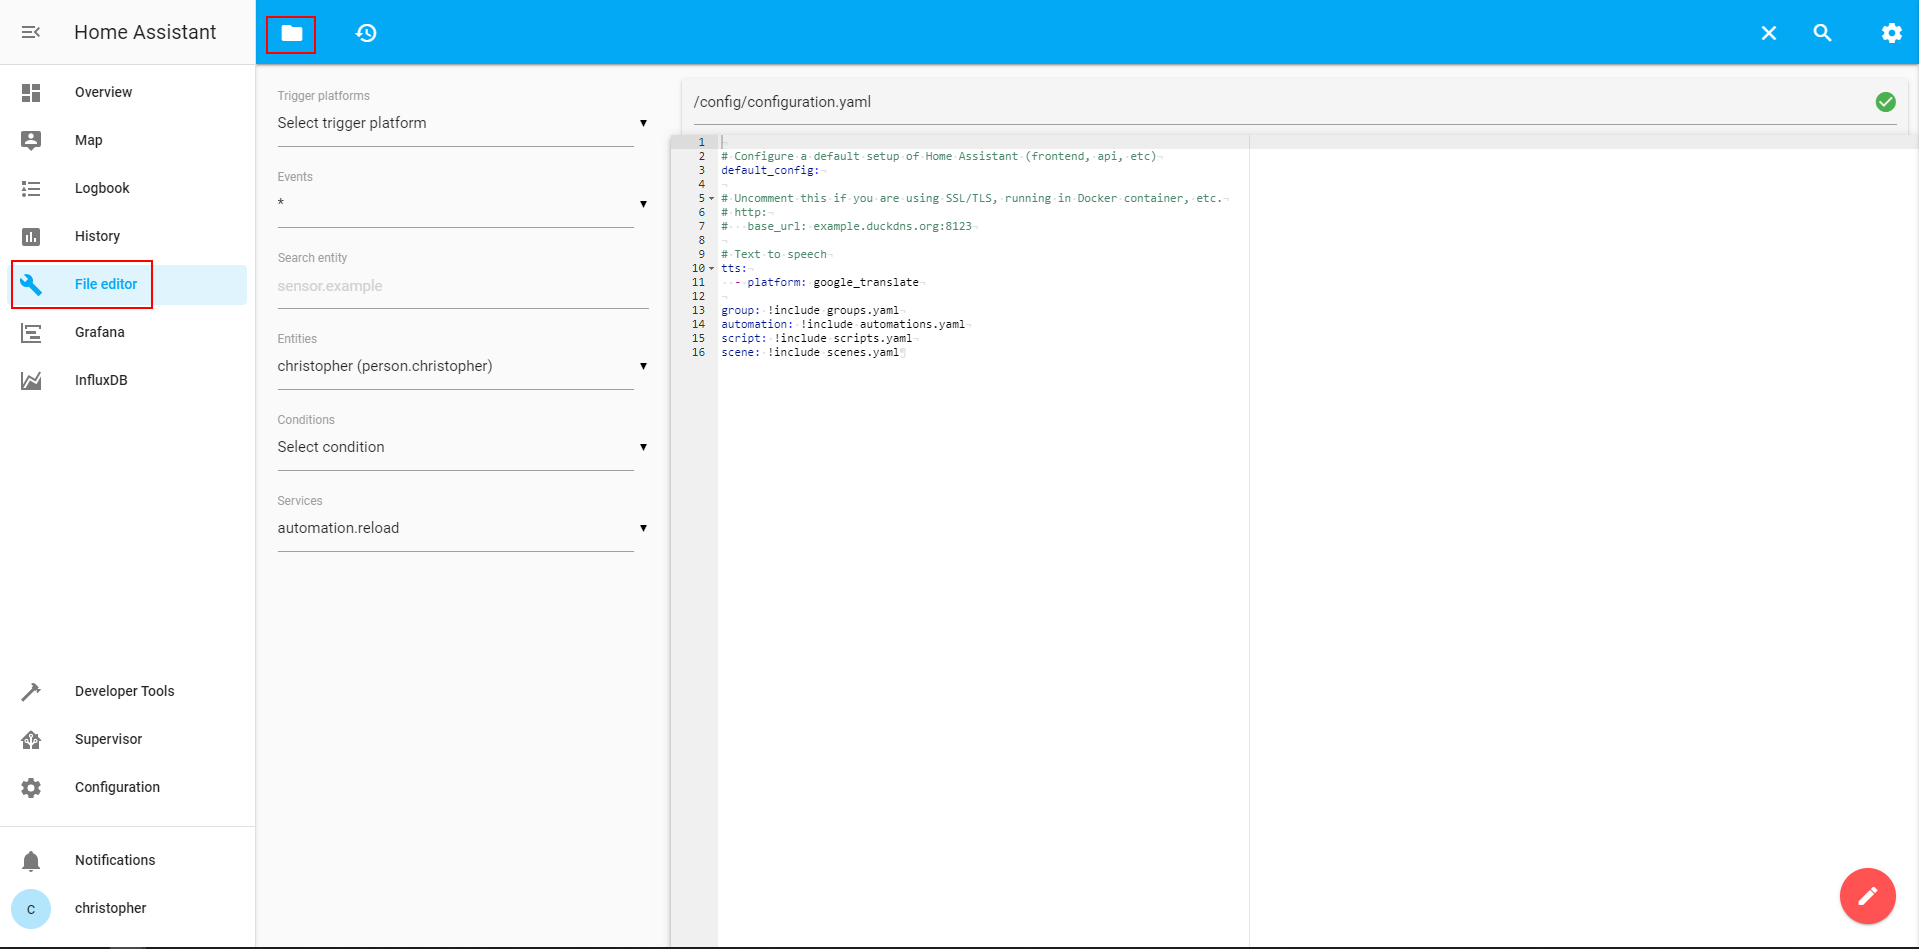
Now we can access the file system over the sidebar and change the configuration file of Home Assistant. You have to click on the folder button on the top and select the configuration.yaml file.
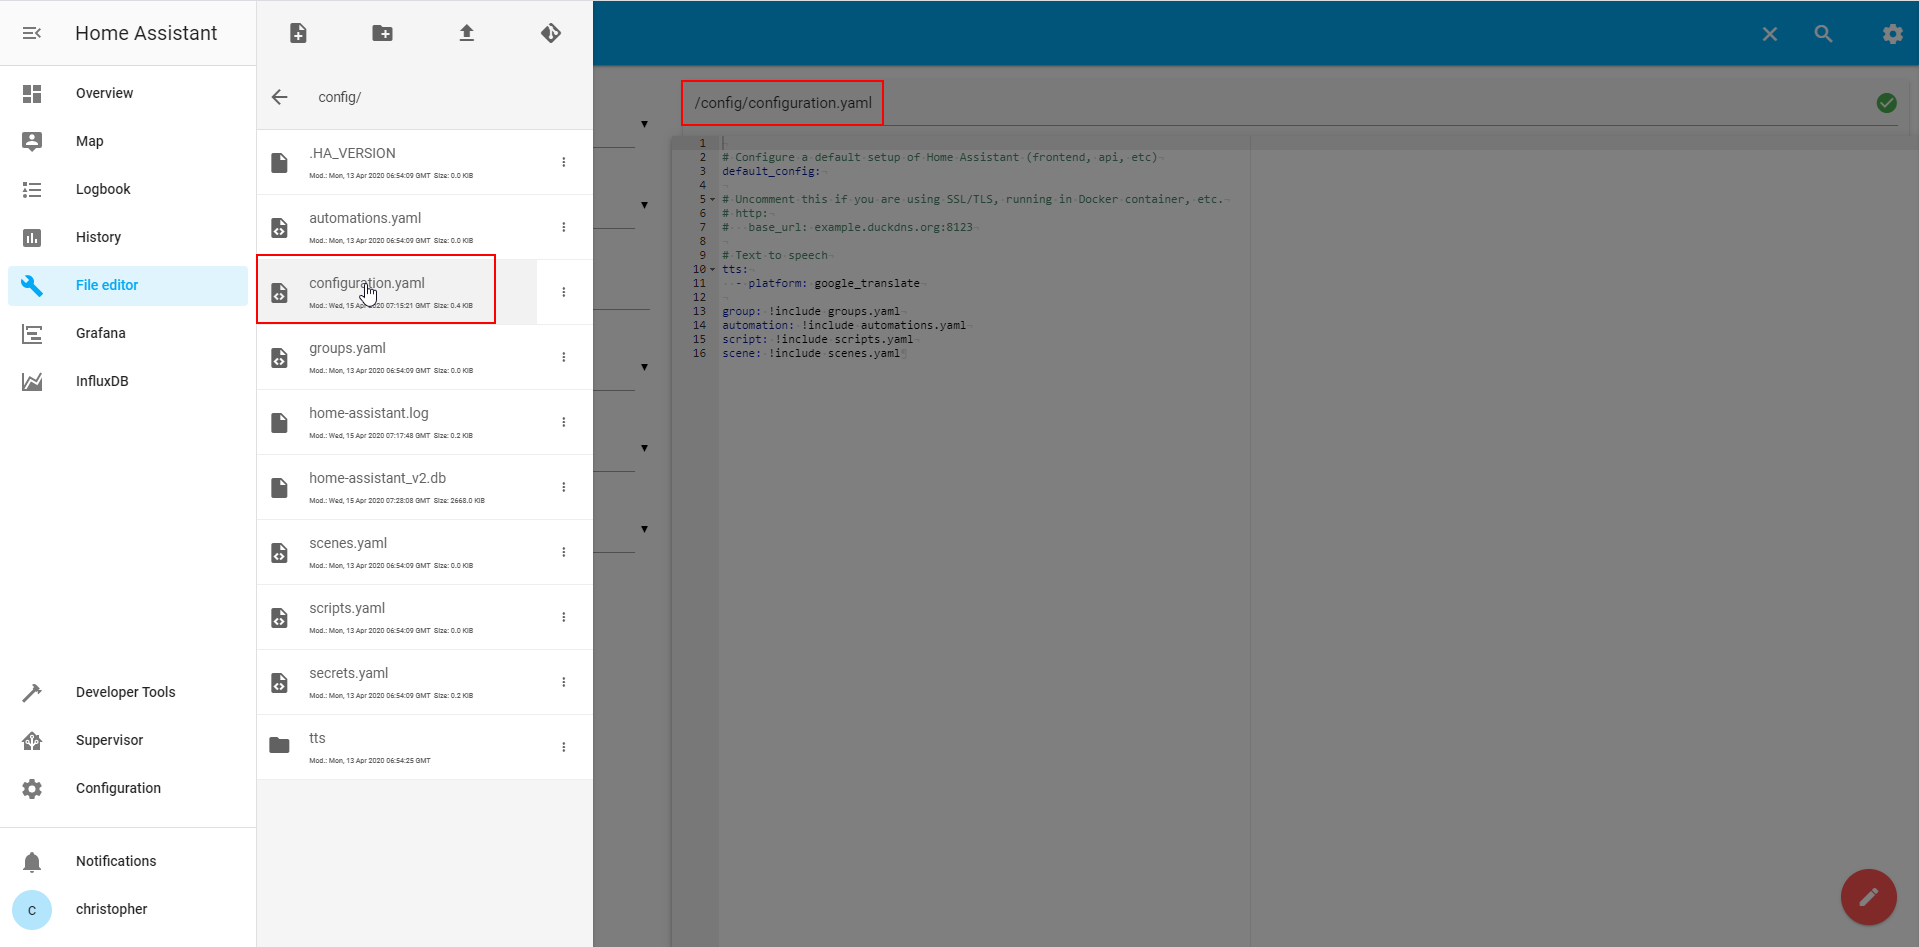
In this file we add a sensor section where we add all sensors independent of the platform. In our case we define that the sensor is an MQTT sensor with the previously defined topic. Then the sensor gets a name and we define the unit of the measurement because MQTT transfers the data as string without a unit.
At this point of the tutorial I give you a bonus: We will not only add the temperature of the weather station but we add also the temperature of the CPU and GPU of the Raspberry Pi and also the clock speed.
Therefore we add the following snippet to the configuration file:
sensor:
    - platform: command_line
      name: CPU Temp
      command: "cat /sys/class/thermal/thermal_zone0/temp"
      unit_of_measurement: "°C"
      value_template: "{{ value | multiply(0.001) | round(1) }}"

    - platform: command_line
      name: GPU Temp
      command: "/opt/vc/bin/vcgencmd measure_temp"
      unit_of_measurement: "°C"
      value_template: '{{ value | regex_findall_index("=([0-9]*\.[0-9]*)", 0) }}'

    - platform: command_line
      name: CPU Clock
      command: "/opt/vc/bin/vcgencmd measure_clock arm"
      unit_of_measurement: "MHz"
      value_template: '{{ value | regex_findall_index("=([0-9]*)", 0) | multiply(0.000001) | round(0) }}'


    - platform: mqtt
      state_topic: 'home/bedroom/temperature'
      name: 'Bedroom Temperature'
      unit_of_measurement: '°C'
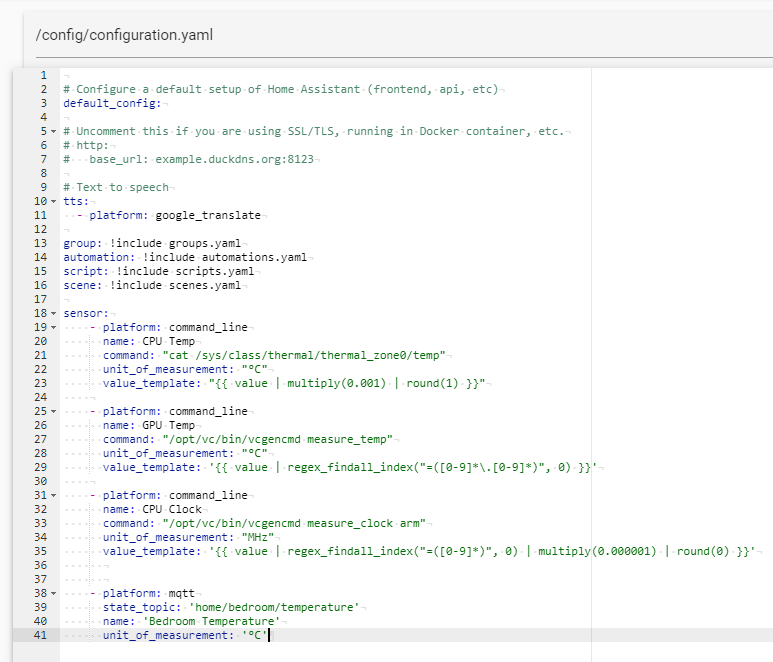
Then we save the file and restart Home Assistant via Configuration → Server Controls → Restart.
There are multiple ways to configure sensors in Home Assistant. If you want to dig deeper into this topic I recommend to read the documentation of Home Assistant.
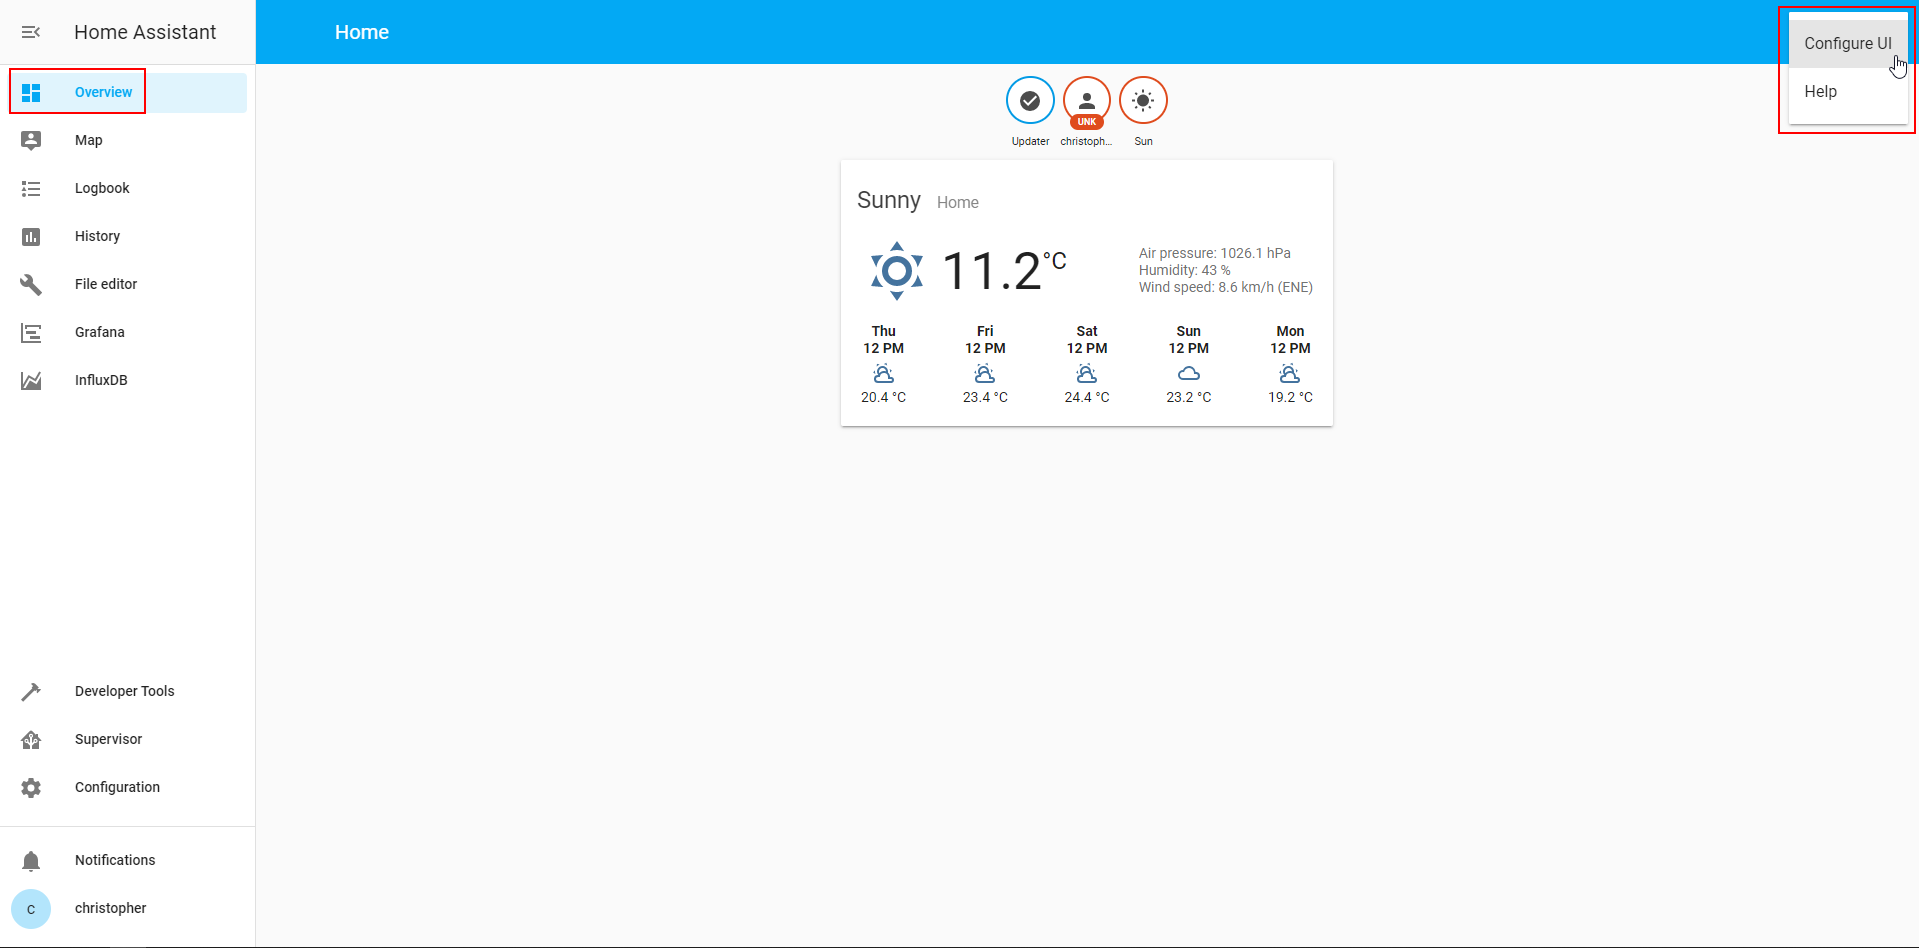
Normally the new sensor data should appear automatically on the overview dashboard. But you can also customize the dashboard with the new added measurements. Click on the three little dots on the top right on the overview screen and select “Configure UI”.
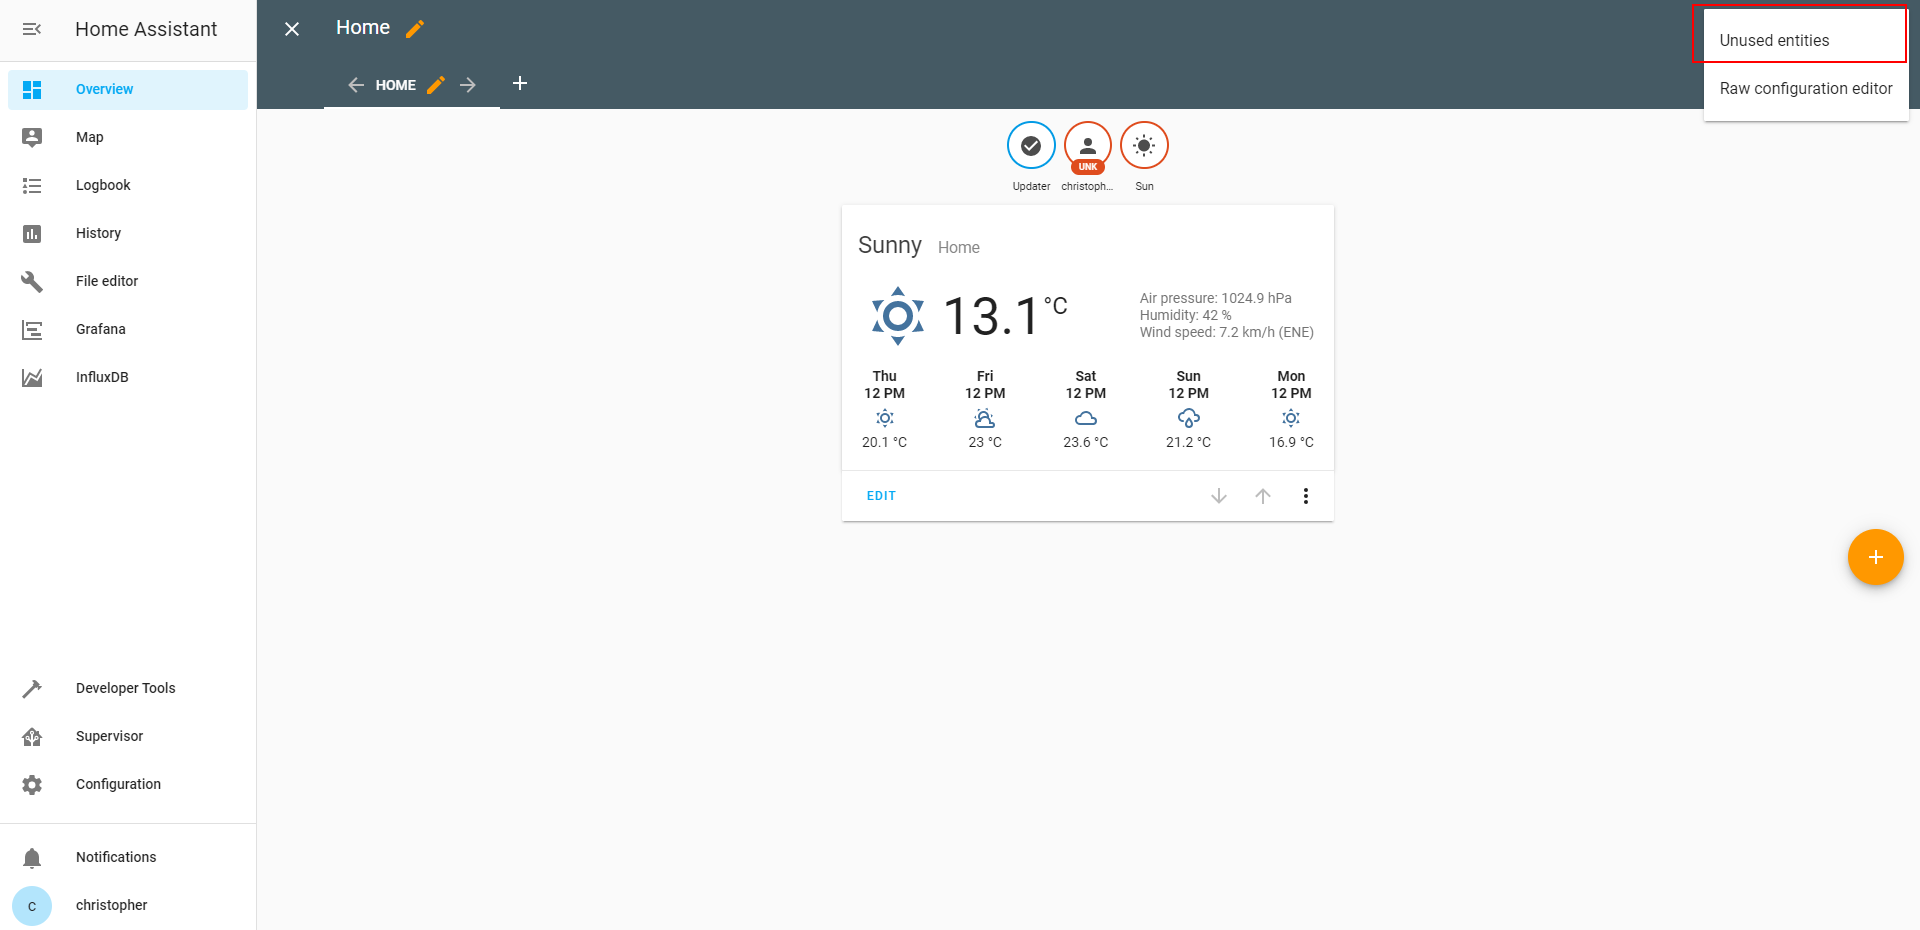
Now you can add new dashboards, add measurement and customize the layout. When you click again on the three little dots you see the button where we can see all unused entries. Click on that button to view all entries that are currently not displayed on the dashboard.
You should see the measurements that we added before in the sensor part of the Home Assistant configuration file. In my case I want to plot the temperatures in a chart. You can select one or more unused entries and click on the orange + button on the lower right corner of the screen. Now based on our decision Home Assistant knows what measurements we selected and we get a recommendation how to display these measurements on the dashboard. You can directly add the measurements to the dashboard with the button “Add to Lovelace UI” or you can pick a different card.
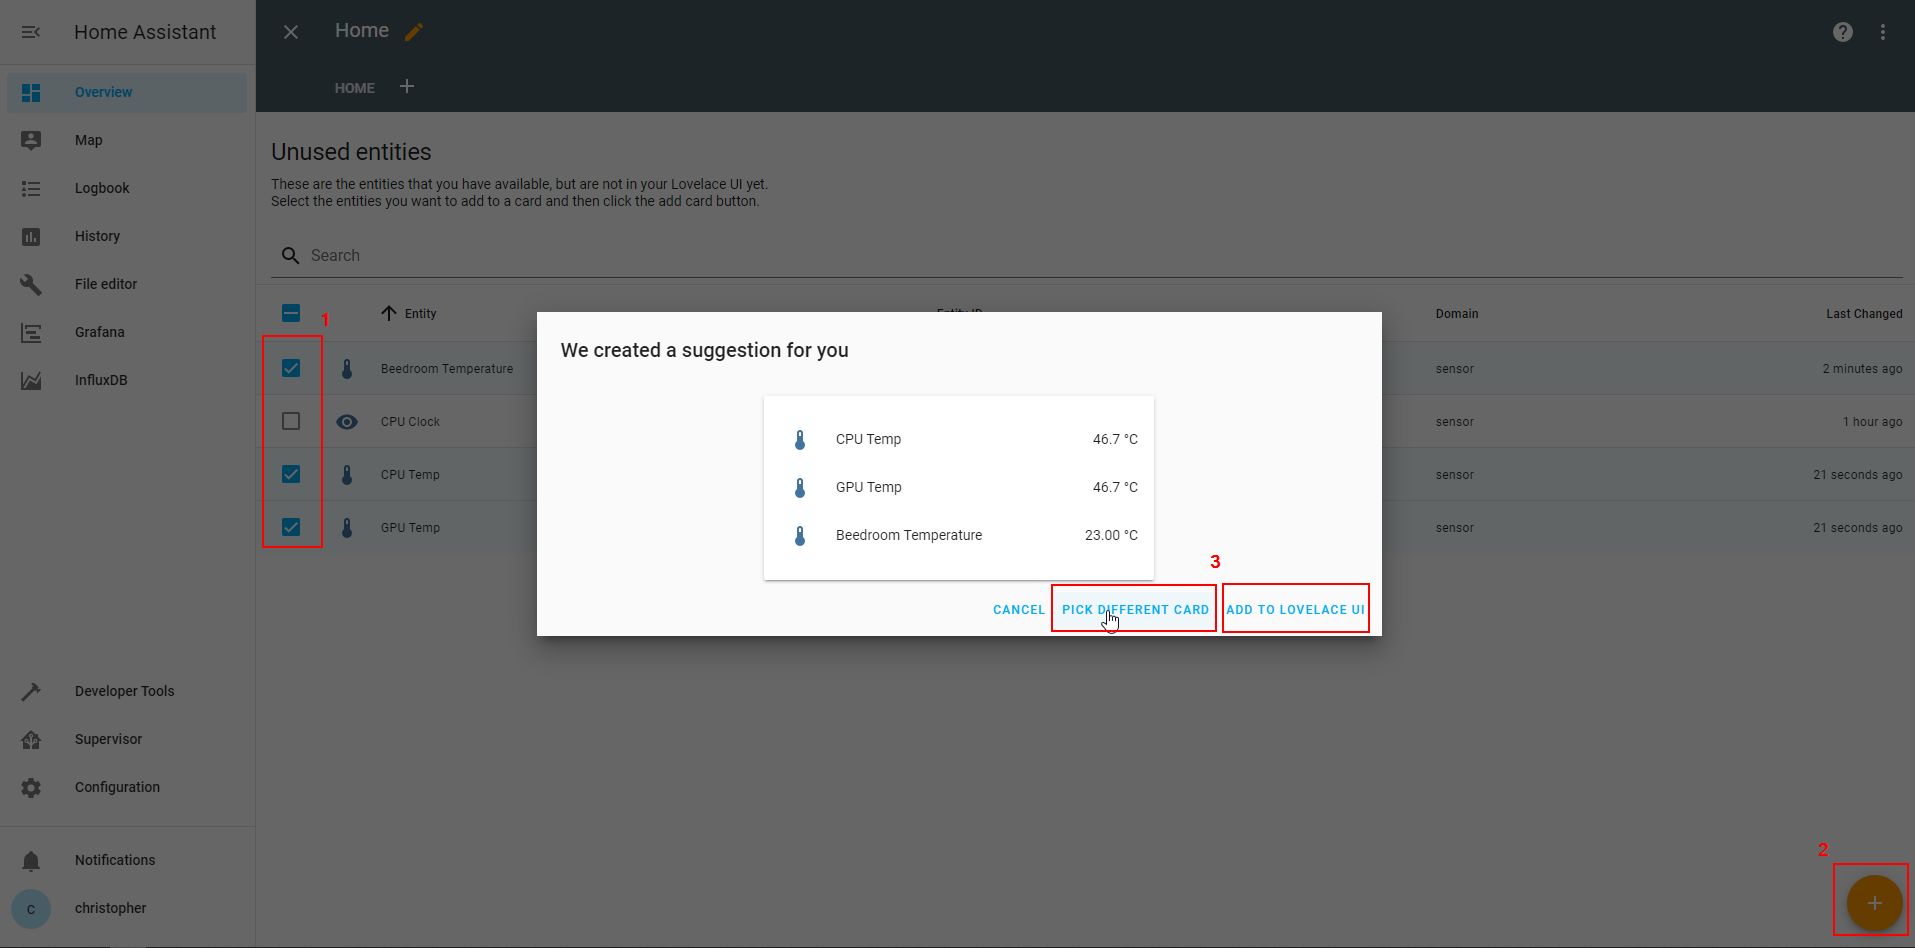
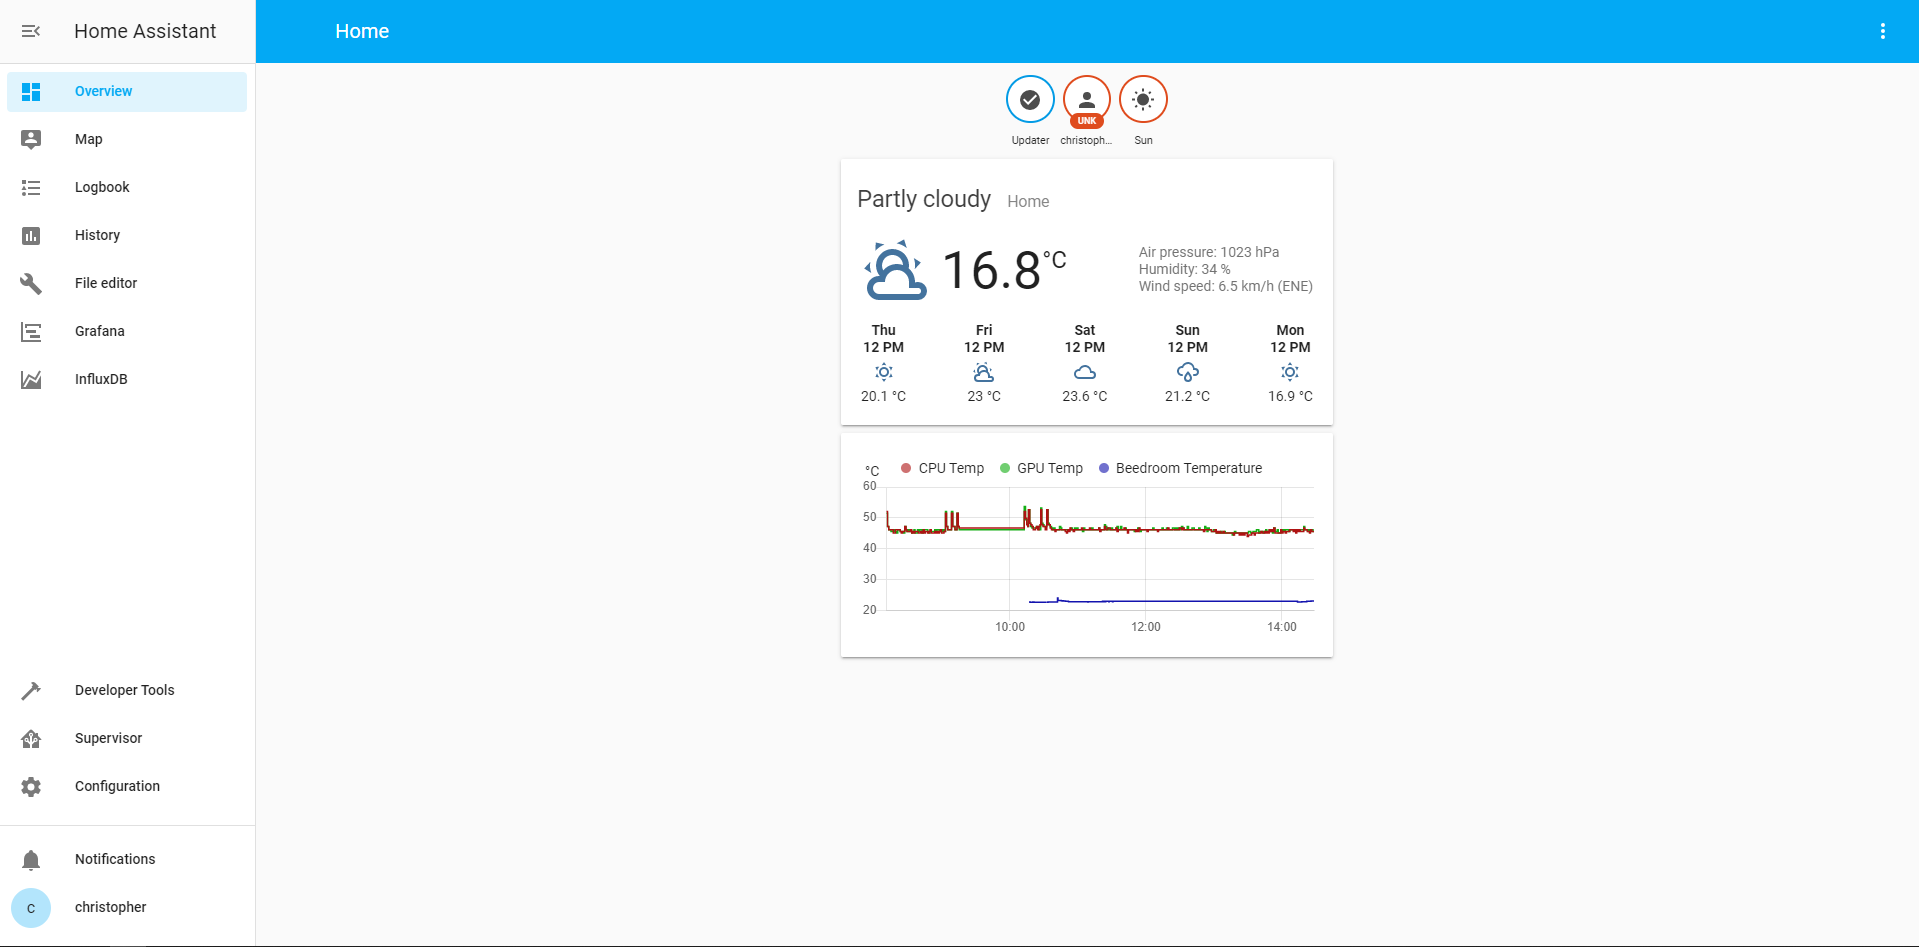
In my case I want to select another card and from the selection of different visualizations I select the history graph. When you click on a card you get more options as you see in my case for the history graph. I can remove or add entities, select a title and define how many hours in the past, the graph should show values. To see a preview of the visualization is a very nice feature of Home Assistant.
When you hit the save button, you see the new card on the dashboard.
Insert MQTT Data into an InfluxDB Database
Now we not only want to display the temperature of the weather station in Home Assistant, but we want to save the data in InfluxDB. To save data in the database we have to do the following 3 things:
- create a database where the MQTT data is stored in
- define a user with an username and password that can access the database
- grant this user access to the MQTT data in Home Assistant
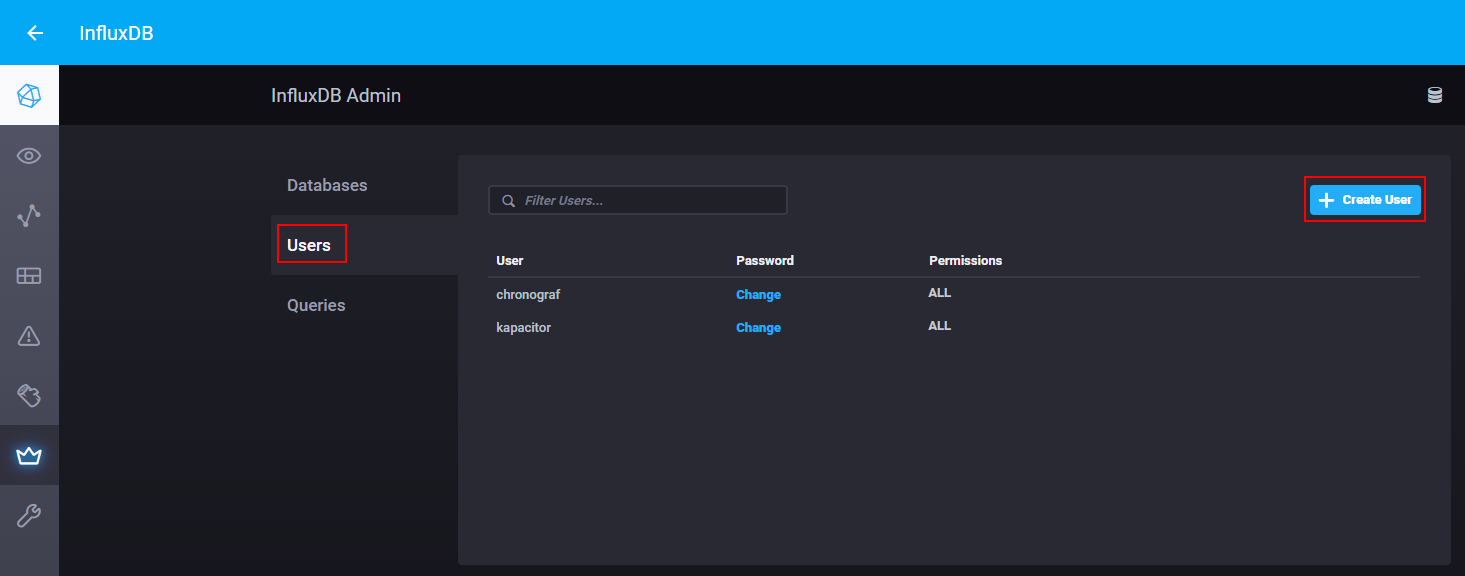
Create a database
First we create a database in InfluxDB. Therefore go into InfluxDB via the sidebar and go into the Admin section.
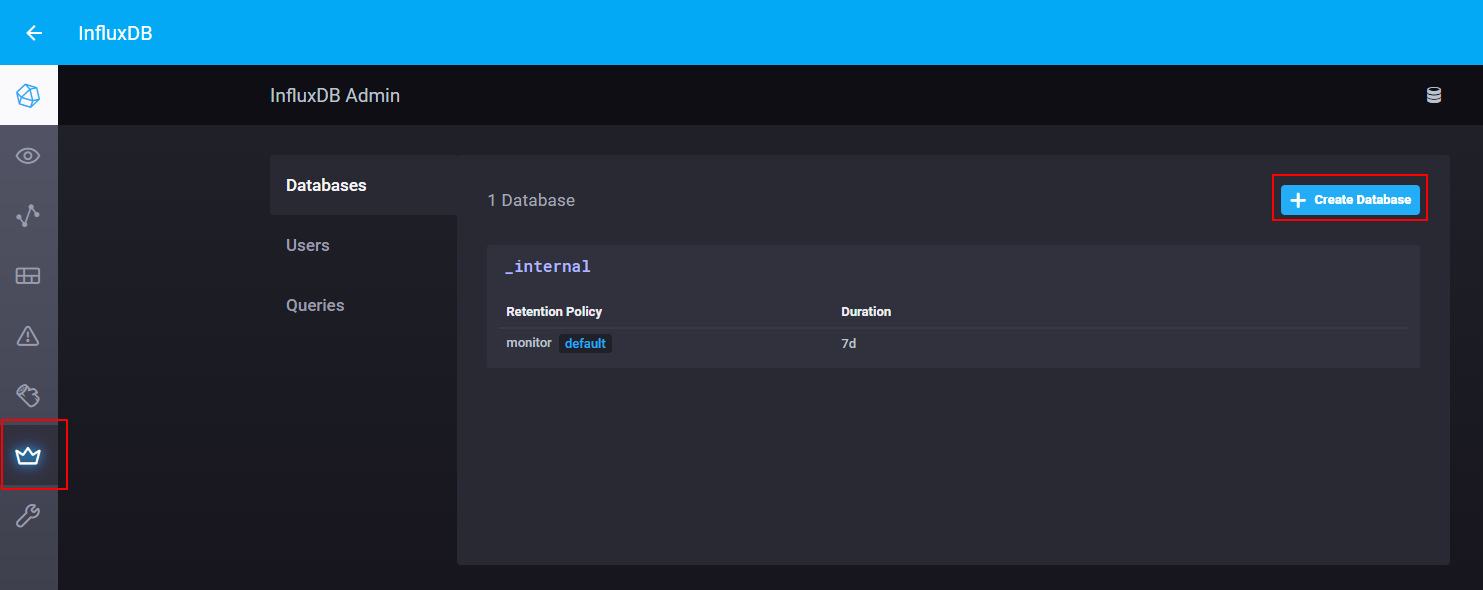
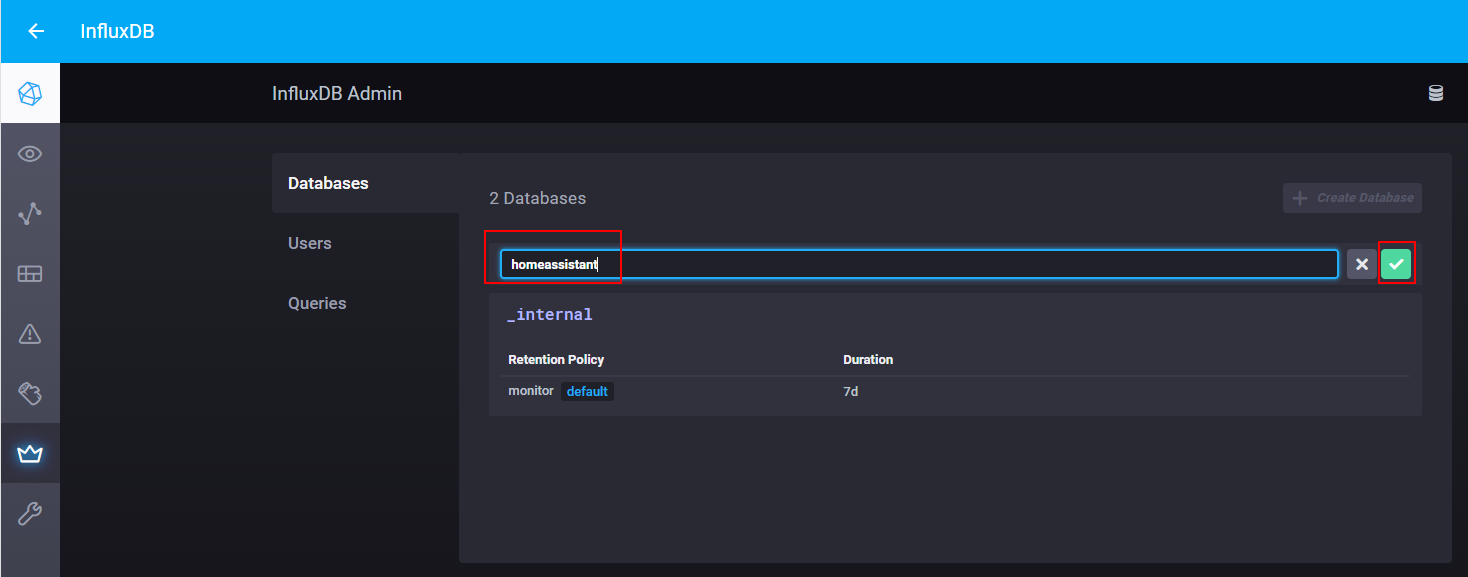
In this admin section we crate a new database called homeassistant.
Create a new user for the database
In the same section we create a new user with the username homeassistant and a password. In my case I also use homeassistant as password.
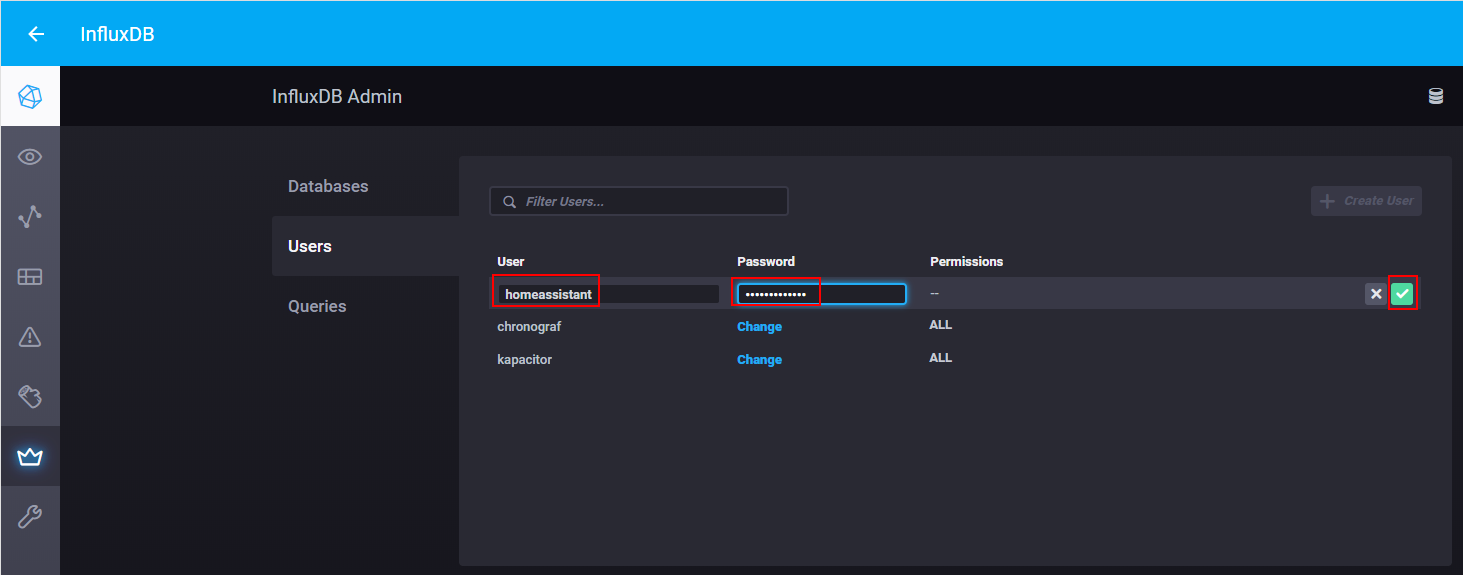
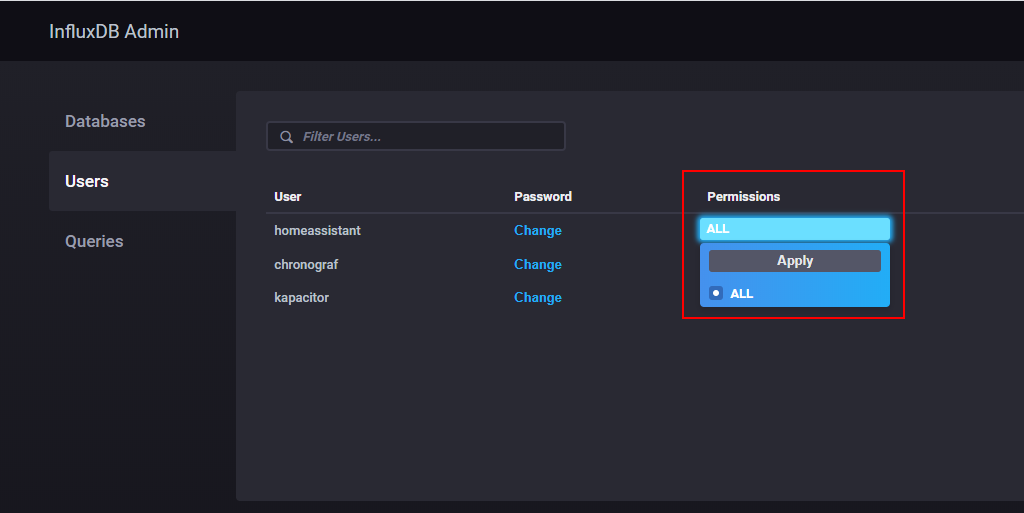
It is important to grant the new user all permissions to write data into the database.
Access the MQTT data in Home Assistant
To access the MQTT data in Home Assistant we have to change the configuration file again with the file editor. We add the following lines to the configuration.yaml file:
influxdb:
  host: localhost
  port: 8086
  database: homeassistant
  username: homeassistant
  password: homeassistant
  max_retries: 3
  default_measurement: state
  include:
     entities:
        - sensor.Bedroom_Temperature
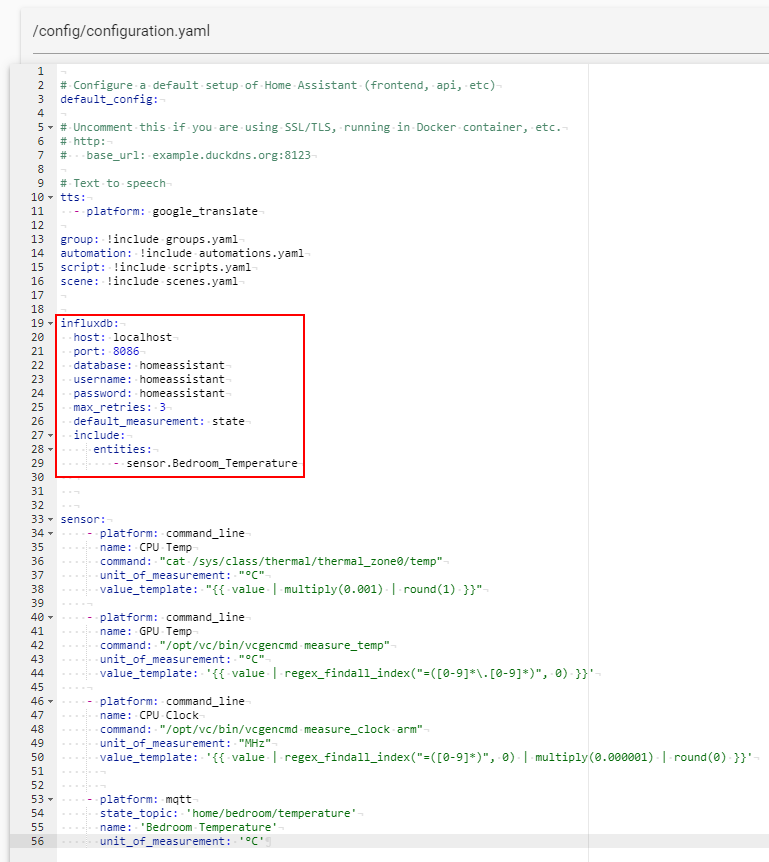
Because we installed InfluxDB on the same Raspberry Pi, the host is local → localhost. The port of all databases is always 8086 and we set the name of the database and user to homeassistant. If you choose an other password, you have to change it. In the include section we can define the entries that we want to save in the homeassistant database. In this tutorial I choose only to save the temperature of the weather station. If you choose a name for the sensor entry with a blank space, you have to replace the blank space with an underscore.
Now we have have to make sure that the measurements are saved into the InfluxDB database. Open InfluxDB again and go into the explore section. In this section you can submit SQL queries to the database. Of course there are more features but in this tutorial we only want to make sure that the data is saved and accessible by Grafana.
With the following SQL query you can see that there is already data saved in the database:
SELECT * FROM "homeassistant"."autogen"."°C" WHERE "entity_id"='bedroom_temperature' 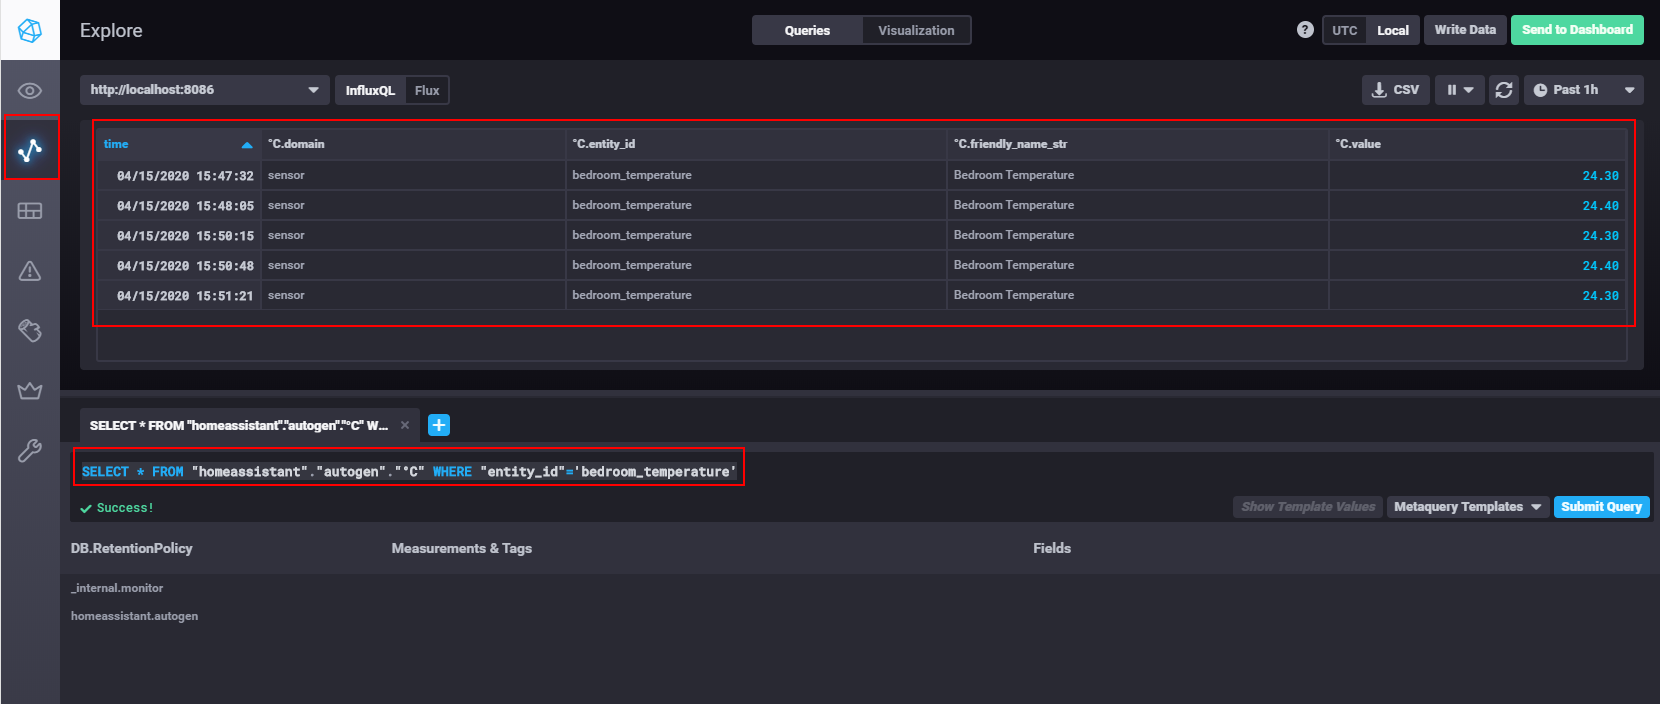
Visualize MQTT Data in Grafana
When you start Grafana the first time you have to enter the combination of username and password:
- Default username: admin
- Default password: admin
The first thing we have to do is to add a data source.
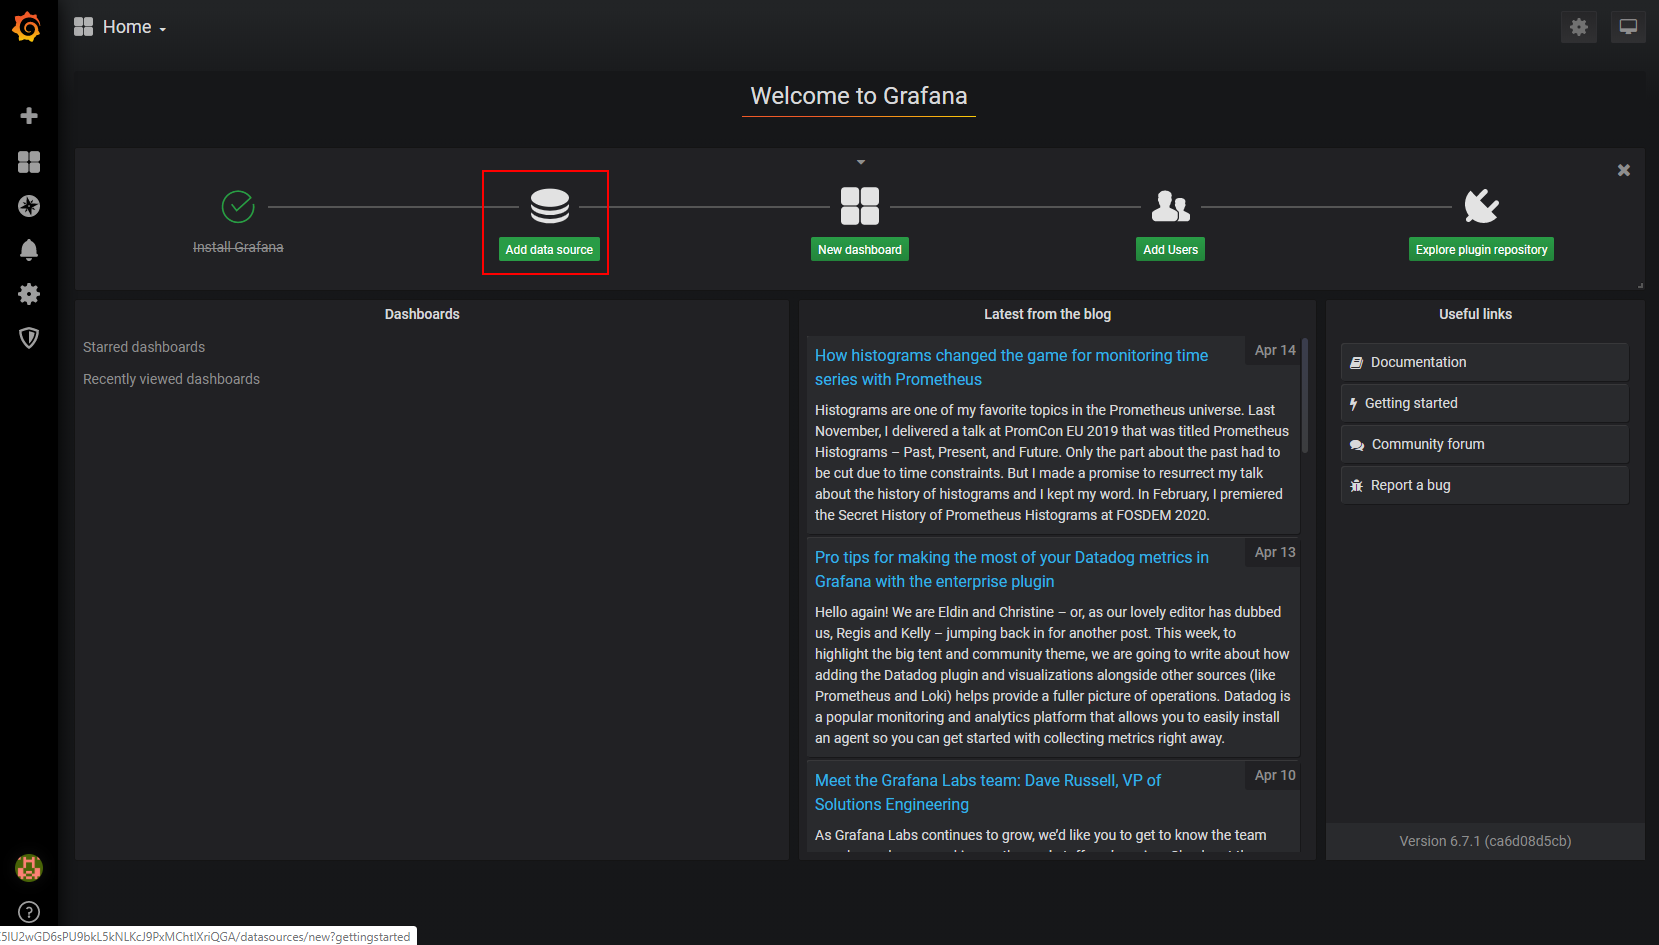
There are a lot of different possibilities to add data to Grafana. In our case we select InfluxDB.

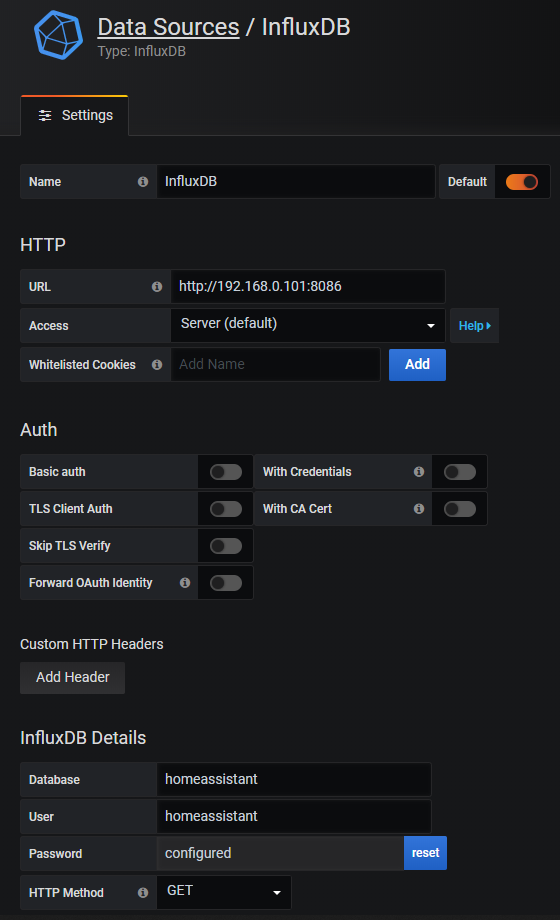
Now we have to define the settings for Grafana to access the InfluxDB database:
- URL: The URL is the IP of your Raspberry Pi and the Port 8086 of InfluxDB. (Note: localhost does not work for me)
- Database, User and Password: The same settings as in the Home Assistant configuration file.
- HTTP method: We want to use the get function to query the database.
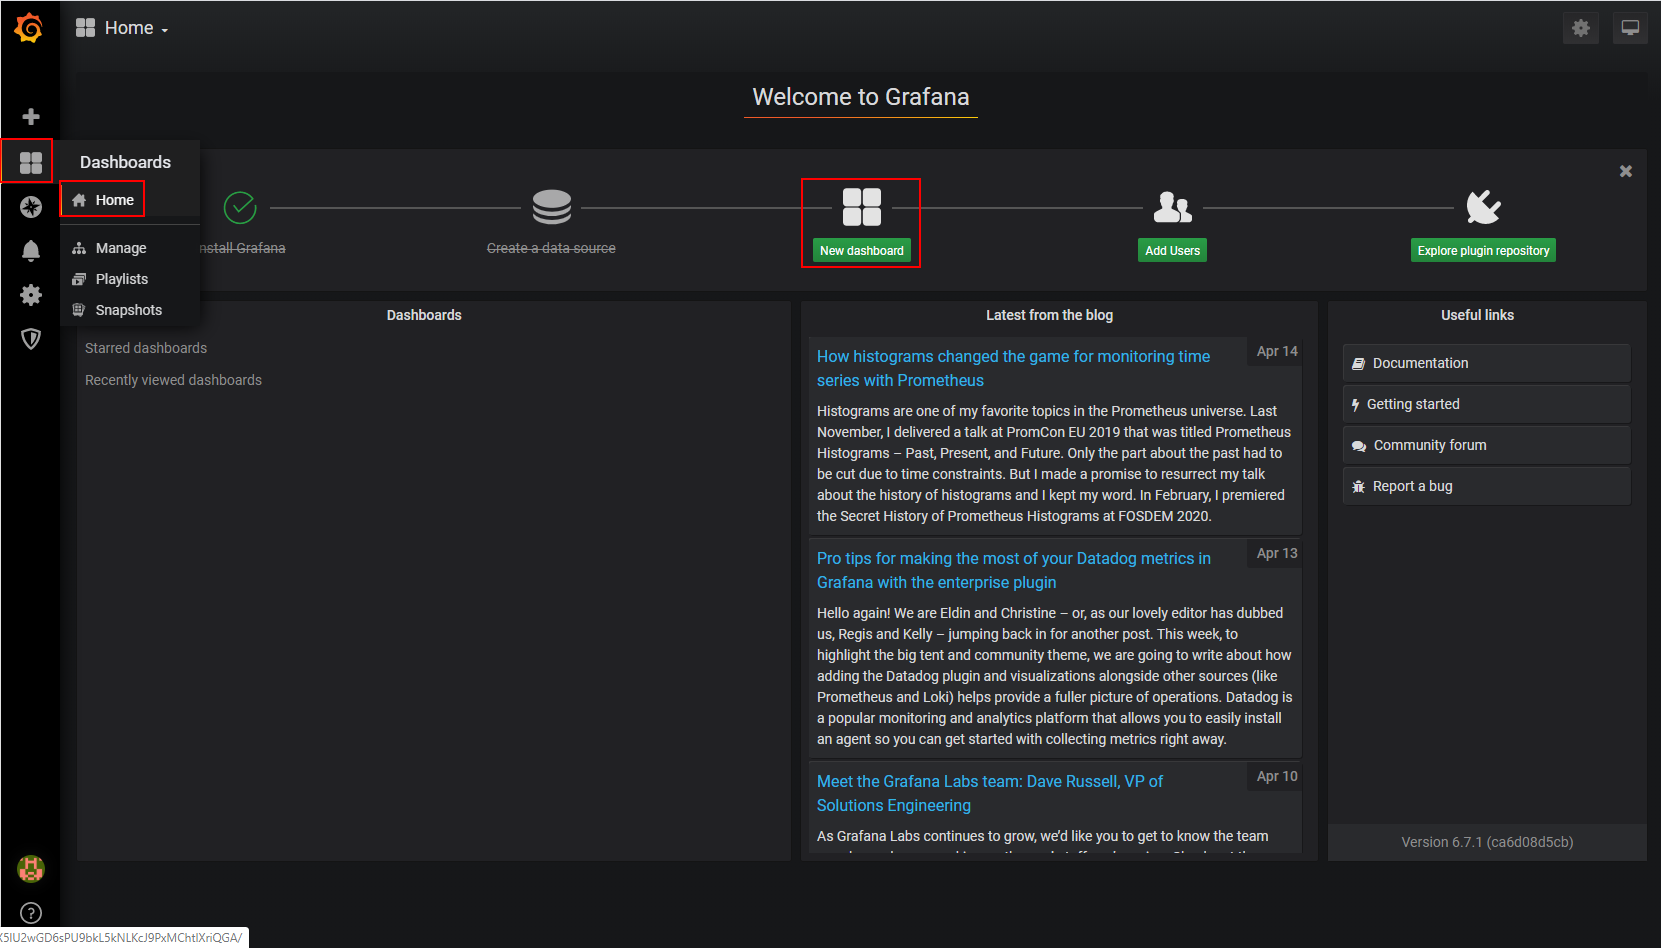
At the bottom of the page you can save & test your settings. When everything works well we go back to the home screen and create a new dashboard.
We choose a new query and now we can define queries either by the graphical interface or by the text editor mode. In my case I choose from all temperatures only the bedroom_temperature as value. To get the view as time series I select that the data should by grouped by the interval time and between the data points in the database there should be a linear interpolation.
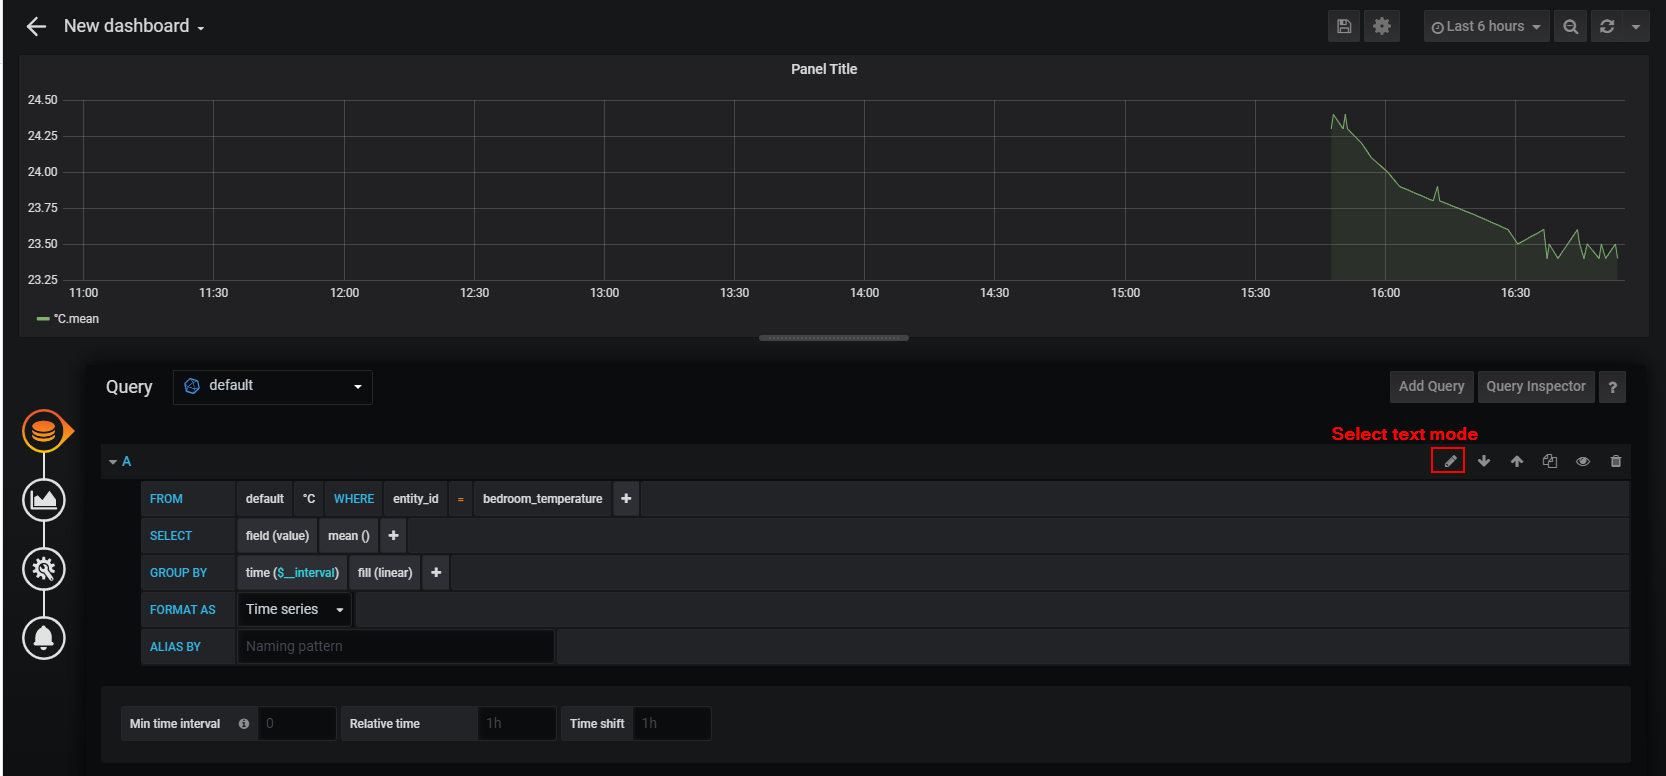
I get the same result when I would use the text editor with the following query:
SELECT mean("value") FROM "°C" WHERE ("entity_id" = 'bedroom_temperature') AND $timeFilter GROUP BY time($__interval) fill(linear) Now I can save the visualization and see the chart on the Grafana dashboard. You can change the title of the chart or the color. There are a lot of options to play with the data. Just try something out but my tutorial finishes at this point because we have everything you need for your smart home up and running.
If you have any questions regarding this tutorial or if you have problems setting up the Home Assistant environment, leave a comment in the following comment section and I will answer your questions as soon as possible.
Great tutorial !
Definitely using this one to expand the HA setup here.
I came here in search for ‘how-to’ to send mqtt messages to a LCD display, unfortunately not found yet.
Situation here is, LCD on ESP module and MQTT broker on the server with HASSIO running in a Virtual Machine. (so three locations)
The LCD works, I can curl or mosquitto_pub to it. But how do I setup HA. Any values that I want to display to it. Could be anything.
Hi, you can setup Home Assistant via…
Docker: https://diyi0t.com/home-assistant-raspberry-pi-docker-setup/
HASS.io: https://diyi0t.com/hass-io-raspberry-pi-setup-tutorial/
Great Job Bro
Hi MEd,
thank you for the response that is a big motivation.
Thanks for this.
It realy helped me to setup the generic MQTT input.
All the best!
It helped me a lot. Thank you.